What is the time when Hivers post and vote/curate the most? Which days of the week? What hour of the day?
Let’s take a look at the latest data from June 2024.

Having in mind Hive is a global community posting and voting time can vary a lot. Different time zones etc. Can users optimize their posting time, so they get some more attention?
Here we will be running the data for posting and voting time in parallel, so users can compare them. We will be looking at the hours, and at the days of the week, and combine them for a heat map.
We will be analyzing a five-week period, May 20 to June 23, 2024.
The time is in UTC. You can compare it with your local time zone here: https://time.is/UTC
Hours
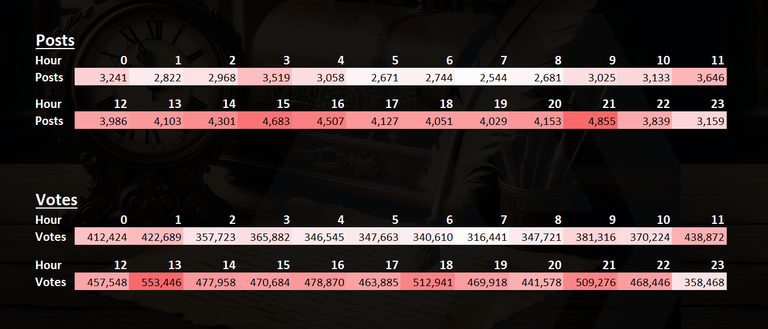
First the hours. Let’s take a look what time of the day Hivers post and vote the most in the period.
Note again on the UTC time.
On the posting side we can see that there is a clear trend, where there is more posting between 13h to 17h UTC, with a peak somewhere around 15h. Overall, there is more posting in the 12h to 22h period, with a second peak around 21h.
Between 5 and 8, there is the lowest number of posts. The drop from the peak hour (22h) to the low hour (8).
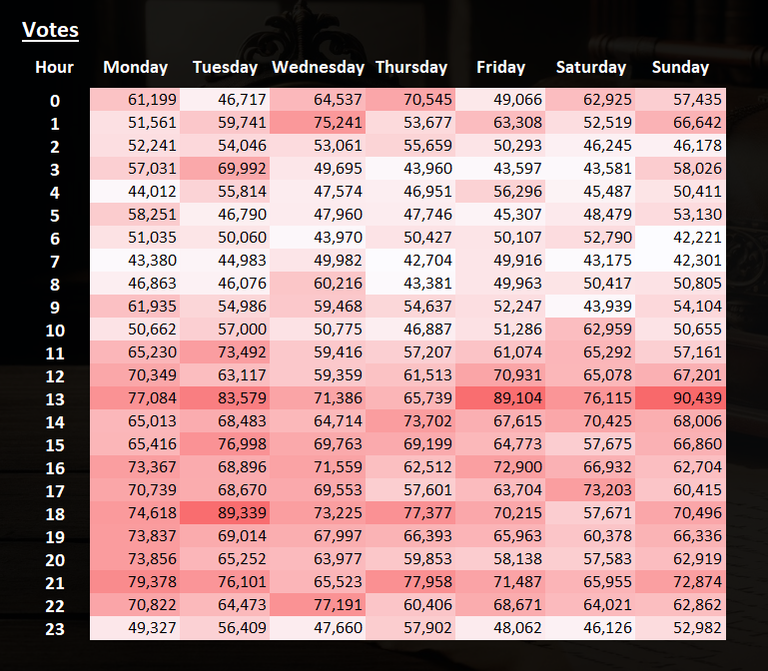
On the voting/curating side there is a slightly different pattern. The peak is a bit earlier in 13h, continued with a high numbers up to 22h, after which it drops in the hours afterwards with a low in 7h.
There are some local peaks in 18h and again in 21h.
The data above is a sum of all the posts in the hours for the analyzed period.
Days of the Week
Now that we have seen the hours data, lets take a look at the days of the week. What days of the week Hivers post and vote the most?
What days of the week Hivers post and vote the most?
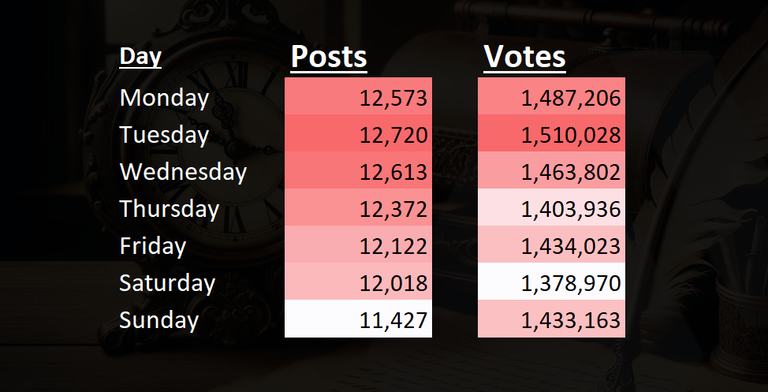
A clear trend on the posts here. Monday and Tuesday are the days with the highest numbers of posts, while the weekend not as much with Sunday being the lowest. Although the drop in the number of posts is not that big. From 12.5k to 11k. Around 10%.
The voting shows a bit of a different pattern, with Saturday having the least voting activity, while Sunday is quite active, almost at the level as for the working days. The peak is in the beginning of the week, Monday and Tuesday having the highest numbers.
Maybe hivers want just to read and curate on Sunday.
Heatmap
Combing the days and hours and we get the heat map.
First the posts:
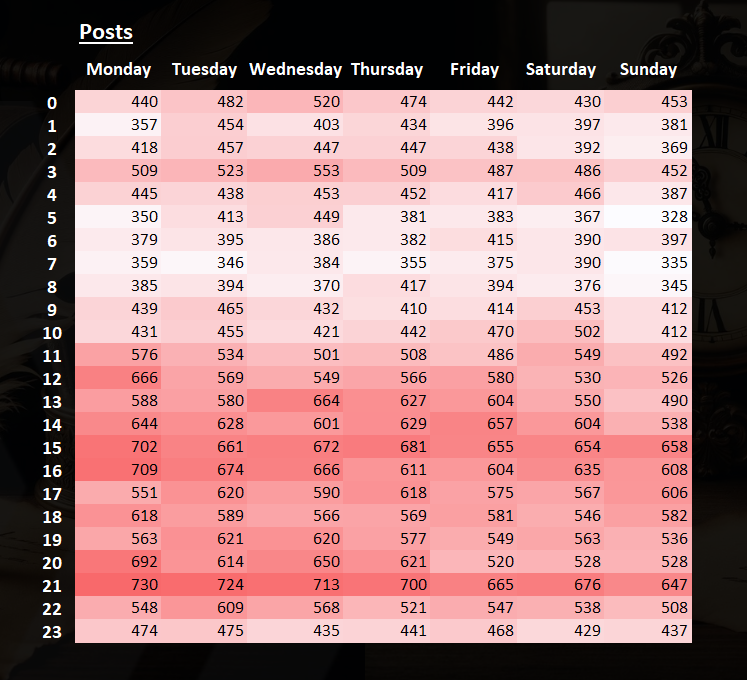
We can see that the start of the week between 12h and 21h is quite busy. This period seems to be divided into two waves, first with a peak around 15h, a slowdown in around 19h and again a second peak around 21h. Going towards the weekend the numbers get lower.
The quite hours are between 4h and 8h.
On a 2D surface chart the same data looks like this:
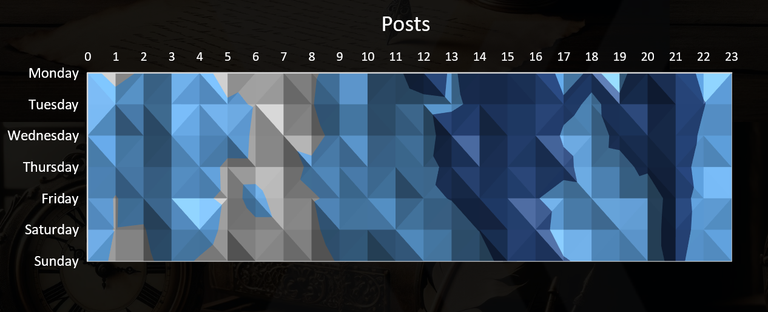
We can notice the height between 13 and 21, the dark blue. In the beginning of the week this area is wider and it’s narrowing down going at the end of the week. Also, the two peak waves are clearly seen here in 15h and another in 21h. The gray area is when the lowest numbers occur between 5h and 8h.
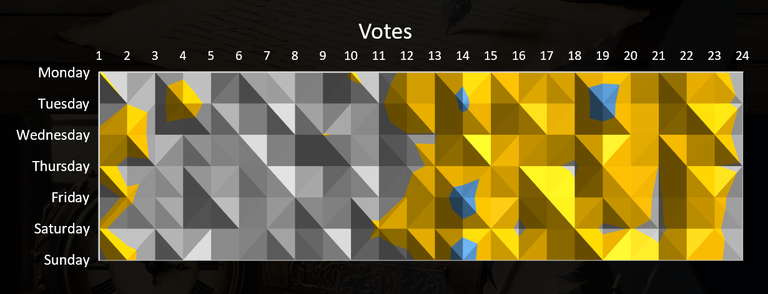
The votes heatmap** looks like this.
Again, voting seems more random than posting. Some spikes happening randomly between hours and days. Although there is more activity in the period as for the posts, that is 13h to 22h. Again, Sunday looks busier for voting than Saturday. Between 4h and 8h is obviously quieter for voting as well.
On a 2D surface chart the voting data looks like this:
Two areas in general. The gray lows between 24h and 10, this is a wider range then posting, and a yellow area representing the period with higher number of votes between 12h and 23h. There are only a few peaks in blue, happening around 14h, but not every day and around 19h in the beginning of the week.
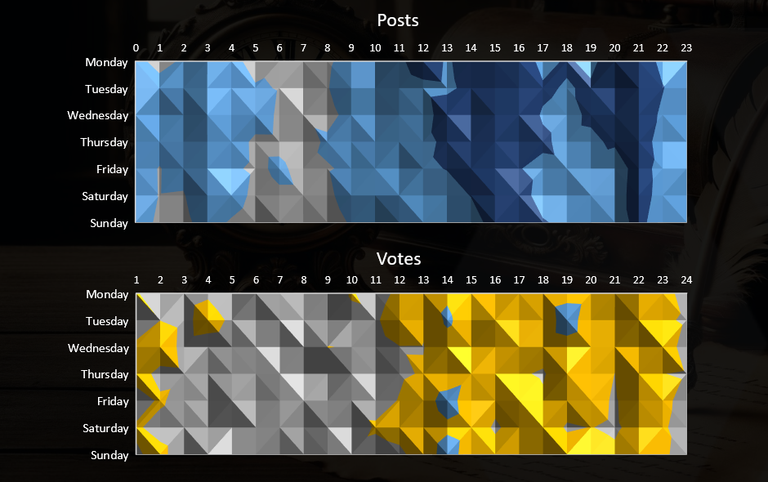
Put together the two charts look like this:
All the best
@dalz
I always find these interesting. you can pretty much tell the time zones for a vast majority of hive. I'm curious if there's anyway possible to pull vote value per day and see how much that changes instead of just votes overall in general.
Vote value? Like active Hive power voting daily?
Yep like the accounts vote weight of powered up hive. Just kind of curious if it changes all that much each day. I would think Sunday as long as you got the same amount of votes would be your highest rewards payday being there is less content. Most likely minimal though.
Coming soon ;)
This is very interesting. I remember looking for such statistics when I first joined the chain... (7 years ago) and sort of kept my time of posting since then. However, things changed a lot so might as well bring some adjustments to my schedule of posting thanks to you! :)
Interesting and useful data analisys as always
Interesting also the hitmap charts
Thanks
!discovery 30
@tipu curate
Upvoted 👌 (Mana: 44/54) Liquid rewards.
I guess there's no way to tell organic votes from the automatic ones. Then the numbers are biased by that :)
I tuink there is decent amount of organic votes, that avctualy creates the difference in the charts
For me 7am pst is 2pm utc and I post every morning, then 9pm pst is 0400 utc when I post my actifit. I fall exactly into the earlier higher temp zones in the tables. It would be interesting to pull the countries and correlate the data to see what region posts when.
Very informative many thanks. 12.5k blog posts a day. That's good to know. I must find these folks.
I know the feeling. Sometimes I look for new posters and different communities and sometimes it feels like a challenge. Perhaps I'm searching on those days and times where everything's a bit slower. :^)
No its not per day ...its five weeks period, so divide that by 5
Wow! This post gives the infos I have always wondered, thanks!
Thank you for sharing your time and effort in collecting these accurate data.😊 The chart you use is not familiar to me, where can I explore the 2D surface chart? It looks like a paint? Thank you.😊
Excel ;)
Oh.. it's in front me and I didn't even try to use it. Thank you.😊 I will try to explore Excel.😊
These are some great insights! Always good to know the numbers! :D
It would be interesting to see a one year view of how this might change over the months.
Its more or less simular
It's interesting how Hivers are more active at certain times and days. Knowing that posts peak around 15h and votes peak earlier helps in timing my own posts better Thanks for the insights brother. Infact I engage a lot and I've realized that most of my friends are less active at certain times
I’m surprised that Tuesday is the highest. I was always thinking that it should be either Saturday or Sunday since it is weekend and a lot of people may have the time to be glued to their phones…
I've been blogging for years before Steemit/Hive and Tuesday has always been one of, if not the best day to post due to people having to catch up on work on Mondays. In effecr, Tuesday becomes the first "free" day of the week for them.
The big question for some is, do you publish on the busiest times and days? (while facing more competition, causing your post to get lost in the increased traffic), or publish on the slower times and days (less traffic, but also less competition, so that your post has a chance to stand out more to LESS of an audience) decisions, decisions...
Interesting!
Very :)
very curious! Thank you for organizing this information
This post was shared and voted inside the discord by the curators team of discovery-it
Join our Community and follow our Curation Trail
Discovery-it is also a Witness, vote for us here
Delegate to us for passive income. Check our 80% fee-back Program
I guess this is the next level of min maxing that authors can take advantage of. I was surprised at how early the peak comes on. I was expecting it around 18H, when people got home.
It looks like we have so many people here who are usually free on Tuesday
Maybe it’s our public holiday😅
It is surprising how stable it is for days, only on Sunday there is a small variation.
I think the number of posts on Tuesday is the community's maximum in terms of the number of posts. Is there a way to compare this data not only daily but also monthly and if possible the yearly data of the number of posts. With this initial data we can analyze if Hive is growing in terms in the number of active users or were having some problems in encouraging Hive users to stay with Hive.
Wow this is very interesting! Thanks for sharing with us :) :)
Oh wow I knew it. Always been around that time. Hehe. Don't notice the voting though but that's good to know as well. Thanks for sharing!
!ALIVE
!LOLZ
!PGM
!DHEDGE
Thank you so much for giving us this comprehensive report