What is the time when Hivers post and vote/curate the most? Which days of the week? What hour of the day?
Let’s take a look at the latest data from December 2024.

Having in mind Hive is a global community posting and voting time can vary a lot. Different time zones etc. Can users optimize their posting time, so they get some more attention?
Here we will be running the data for posting and voting time in parallel, so users can compare them. We will be looking at the hours, and at the days of the week, and combine them for a heat map.
We will be analyzing a five-weeks period, April 14 to May 18, 2025.
The time is in UTC. You can compare it with your local time zone here: https://time.is/UTC
Hours
First the hours. Let’s take a look what time of the day Hivers post and vote the most in the period.
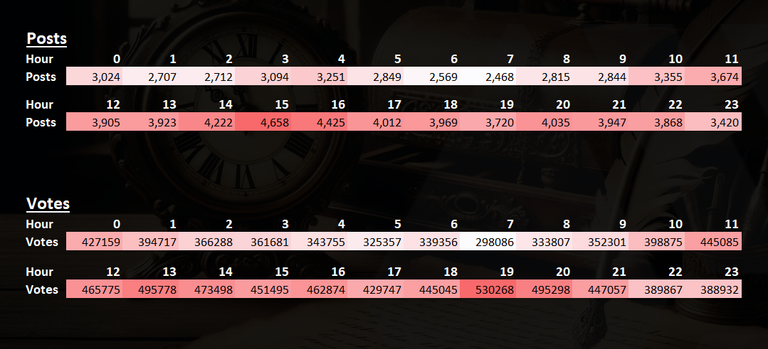
Note again on the UTC time.
On the posting side we can see that there is a clear trend, where there is more posting between 13h to 17h UTC, with a peak somewhere around 15h and a second peak around 20h. Overall, there is more posting in the 12h to 22h period.
Between 5 and 7, there is the lowest number of posts. There is a drop from (22h) to the low hour (6).
On the voting/curating side there is a slightly different pattern. There is a double peak here as well with the first, lower one a bit earlier then the posts around 13H, and then the second one, the highest one around 19H.
The data above is a sum of all the posts in the hours for the analyzed period.
Days of the Week
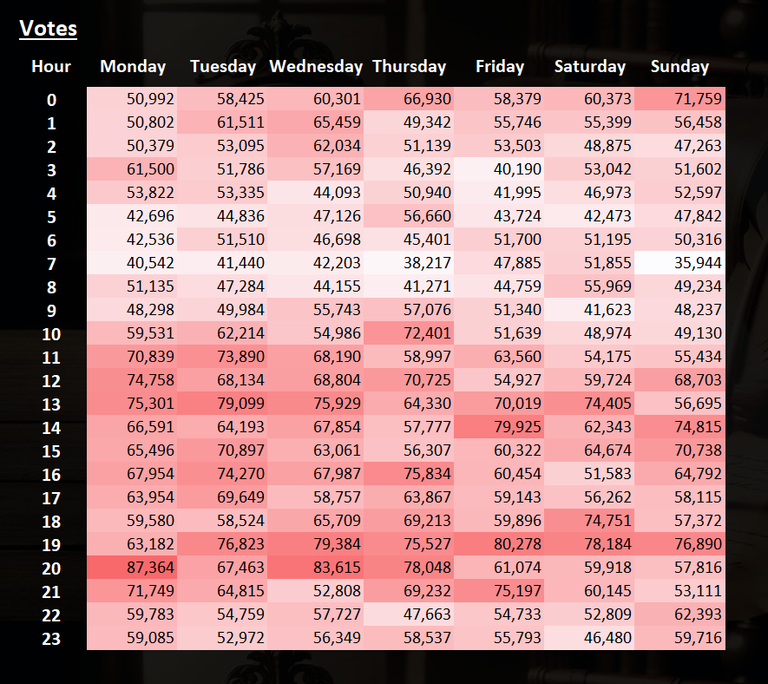
Now that we have seen the hours data, lets take a look at the days of the week. What days of the week Hivers post and vote the most?
What days of the week Hivers post and vote the most?

A clear trend on the posts here. Monday and Tuesday are the days with the highest numbers of posts, while the weekend not as much with Saturday being the lowest. Although the drop in the number of posts is not that big. From 12k to 11k. Around 10% difference.
The voting shows a similar pattern, with the peak in the first days of the week and a drop going forward in the weekend. It is interesting that even Friday is a day with lower activity overall. From Monday to Wednesday activity remains high.
Heatmap
Combing the days and hours and we get the heat map.
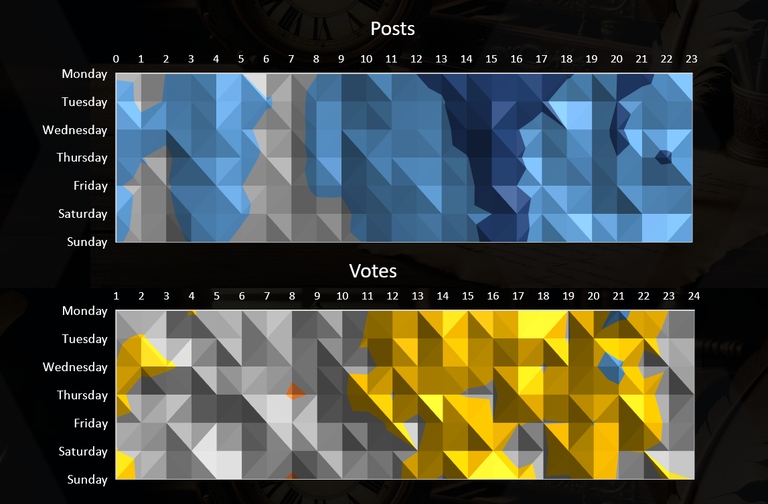
First the posts:

We can see that the start of the week between 12h and 22h is quite busy. This period seems to be divided into two waves, first with a peak around 15h, a slowdown afterwards and again a second peak around 21h. Going towards the weekend the numbers get lower. Wednesday at 15h is the highest activity in the week.
The quite hours are between 4h and 8h.
On a 2D surface chart the same data looks like this:

The gray is with lower activity, blue with higher activity. We can clearly see the higher activity at the beginning of the week in the range of 13h to 17h, then a slowdown going forward.
The votes heatmap looks like this.
Again, voting seems more random than posting. Some spikes happening randomly between hours and days. Although there is more activity in the period as for the posts, that is 13h to 22h. Sunday looks busier for voting than Saturday. Between 4h and 8h is obviously quieter for voting as well.
On a 2D surface chart the voting data looks like this:
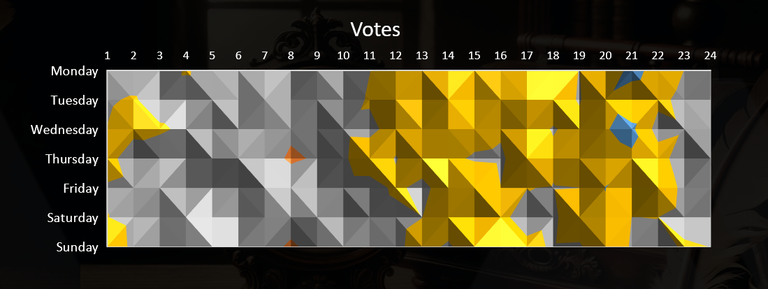
Three zones here. The gray represents somewhat of a middle ground, the orange the lows and yellow the peak. Around 15h is usually the peak especially in the working days, while the lows in the period of 4h to 9h.
Put together the two charts look like this:
All the best
@dalz
The heat maps are a really good way of presenting this data. Thank you for sharing.
Wow!! Incredible analysis, I love the way you visualized and explained this, showing how you put together the data for your final result. 100% awesome, and relevant to my interests :D
This post is very helpful for me and I just reading all the comments I learn this such an amazing information.
Interesting analysis of Hive activity patterns! 📊 And with this in mind, I'm going to try scheduling posts to maximize visibility and engagement, because it doesn't matter when I post since I get so few votes.
Interesting data. Most of the time I just post at 8.00 (GMT+3.) I prefer to post in the morning. that way I know that no matter what happens I will not miss posting that day.
I think it works similar with the different time zones, and there are alot of factors that can contradict this just as listed. amazing analysis, works similar with my predictions 👌
I love this post so much seriously
Impressive!
A doubt: are the times geografically ajusted? Can it be timezones and demography question influencing theses maps?
!HUG
!WRD
!INDEED
!HOPE
!PIZZA
!LOLZ
Curation of course is delayed than publication, time for people to read and vote
Interesting and informative post 👏
Very Good post
$PIZZA slices delivered:
@pablito.saldo(5/5) tipped @dalz
Come get MOONed!
Earlier I used to post every day between 5 and 7 am and worked all night, but now the way you have mentioned this particular thing, I will also try to post between 5 and 10 pm and then I will see if there is any difference or not.
I love to know this! A long time ago a Hiver (sorry for not remembering the user) said that the best days to post if you wanted your blog post to be read (not voted, read) were Thursday, Friday, and Saturday, because those days there were not so many new posts and there was more chance that your post would not be lost in the feed compared to the other days 👀 👏
Thank you very much for sharing those graphs (っ ˘ω˘ς)