One feature that I haven't seen available at https://hive-engine.com or https://steem-engine.com is how to view historical market price charts for a token. Ironically, while working on this post, I started seeing the candlestick plots on Steem Engine. Nonetheless, the APIs have a history/marketHistory endpoint that provides daily price summaries (thanks @dalz for this info).
Since I often want to visualize historical price data, I created a Python Jupyter notebook on Google Colab. The user can choose any token symbol, and the notebook does the rest.
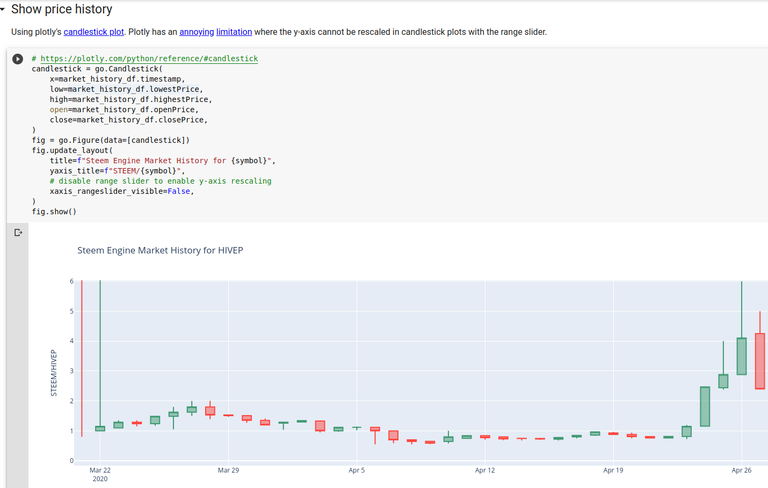
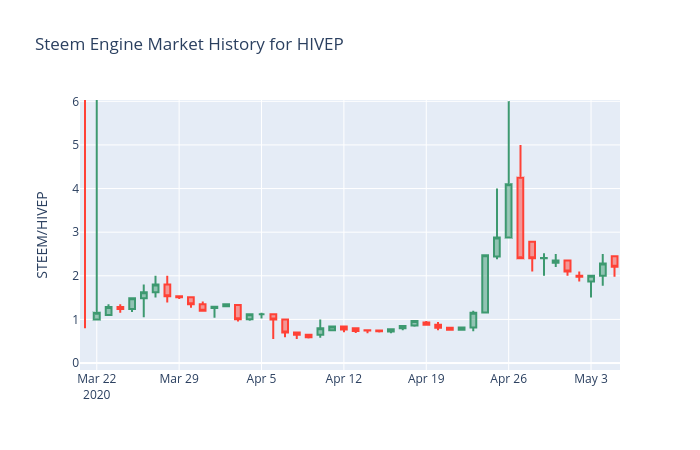
Since the figures are created using Plotly, they're interactive. For example, you can zoom in to reduce the y-axis to trading following the initial HIVEP volatility.
We can also plot daily volume:

Looking forward to anyone building off this code and reusing the notebook, so I released it under the open CC BY License!
Python code
Programming in Python is lot's of fun, since you can accomplish a lot with little code. For example, here's a snippet of just the code to retrieve the market history data and transform it into a dataframe (tabular data structure) and convert the dates to a more human-friendly encoding.
symbol = "HIVEP"
url = "https://api.steem-engine.com/history/marketHistory"
response = requests.get(url, params=dict(symbol=symbol))
response.raise_for_status()
market_history_df = pandas.json_normalize(response.json())
market_history_df.timestamp = pandas.to_datetime(market_history_df.timestamp, unit="s")
Oh I missed this post :(
Certainly useful piece of code
All Greek to me to be honest but I am sure you just created something cool and useful :)
Btw hive.blog has been buggy too today... Probably all Hive front ends.
Yeah, now I'm not even seeing this post on hive.blog. But I can see your comment at https://hive.blog/@dhimmel/replies and reply to it.
Yeah. It looks like the front ends kind of got stuck in a 5 hour old time loop and they now randomly switch between the loop and the actual reality :) Interesting.
Thanks!
Will play around with this. I'm still a Python amateur. Excel got me :)
For some reason this post shows up on hive.blog for me but not @peakd:
Because of the node you're using... some of them have been fixed and some haven't.
Makes sense! Are there any posts or GitHub/GitLab issues or pull requests about the bug? I'm always interested in learning about why the blockchain / APIs malfunctioned.
Thank you very much for this tool, I was still wondering how to do it before but now I found thanks to you.
Programming will always remain a mystery to me
Congratulations @dhimmel! You have completed the following achievement on the Hive blockchain and have been rewarded with new badge(s) :
You can view your badges on your board and compare to others on the Ranking
If you no longer want to receive notifications, reply to this comment with the word
STOPDo not miss the last post from @hivebuzz:
Vote for us as a witness to get one more badge and upvotes from us with more power!
interesting this will be to use and analyze thanks for sharing this one :)
Thanks for sharing this with us. Gracias
Thanks for sharing this informative article with us
Thanks for the update...💯💯💯