A few words
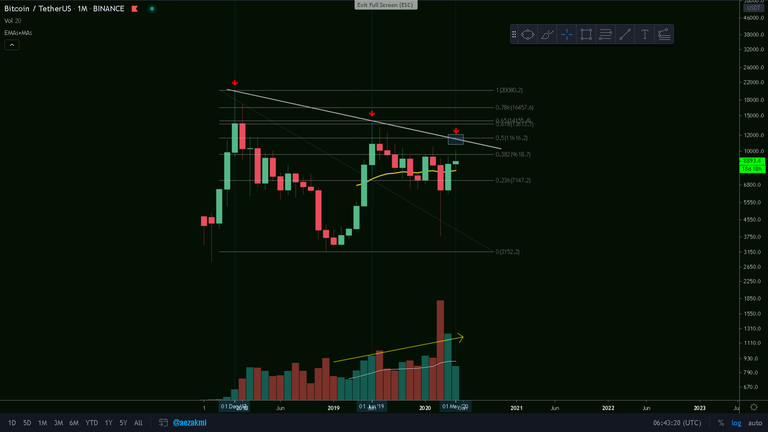
At the end of the day, there's really just one simple line that indicates the direction of the market. Excluding indicators, charting tools and other instruments, one can simply draw a line from the the December 2017 peak to the June 2019 peak and extend it. Now this specific trend line can be drawn from the candle wicks or candle bodies.
Wick-to-wick
As you can see, drawing the line wick-to-wick style gives us a next potential target at $11500. Furthermore, the Fibonacci retracement (Dec 2017 High - Dec. 2018 Low) gives us the 0.5 level at this same level, adding a further layer of resistance. Speaking of it, the $11000 level is near the June 2019 high, so if we're closing the candle in this area, one could see a double top pattern. The trading volume (Binance) is steadily increasing and I consider that a monthly candle wick to $11500 is quite achievable.
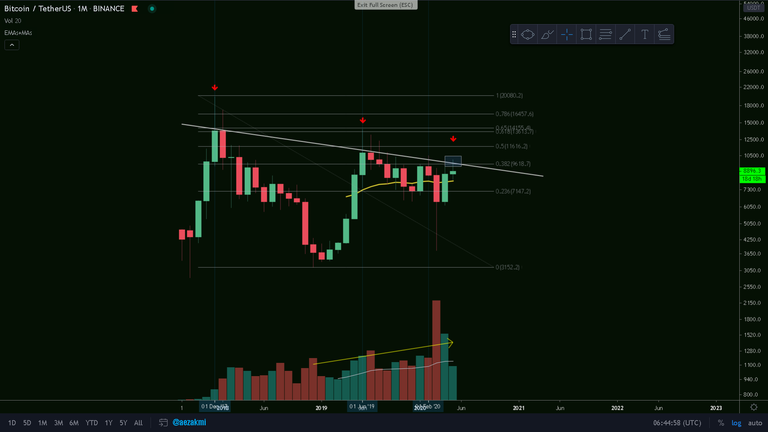
Body-to-body
Drawing it this way, gives us a target at around $9600 - a level that we already achieved last week. The trend line drawn body-to-body style also aligns with a Fib. retracement level: the 0.382. Closing the monthly candle above the $9600 level would definitely bring some bullish sentiment, however, I wouldn't lay my bets until we close above the 'wick-to-wick' trend line.. just to be sure.
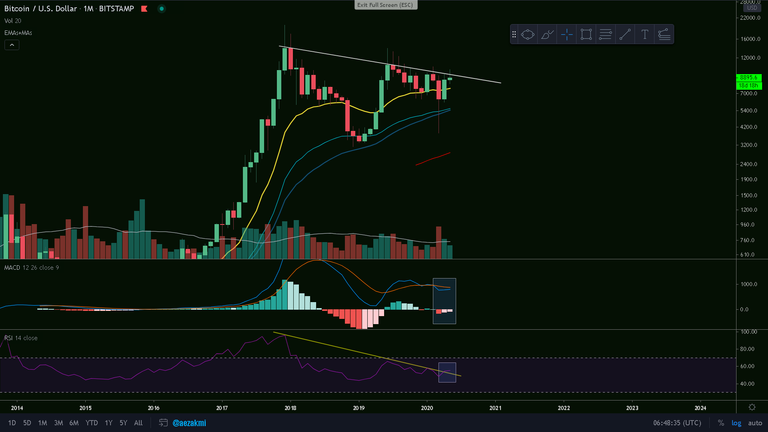
Indicators #1
It looks like the RSI broke the descending, two-and-a-half year long trend-line before the price did, but's to early to announce anything meaningful. The MACD is also indicating a descending bearish Histogram, but the momentum is pretty weak. Getting a rejection at the trend line again - either body-to-body or wick-to-wick - would probably bring us again to the 50 & 55 MA and EMA (blue) - currently at $5600.
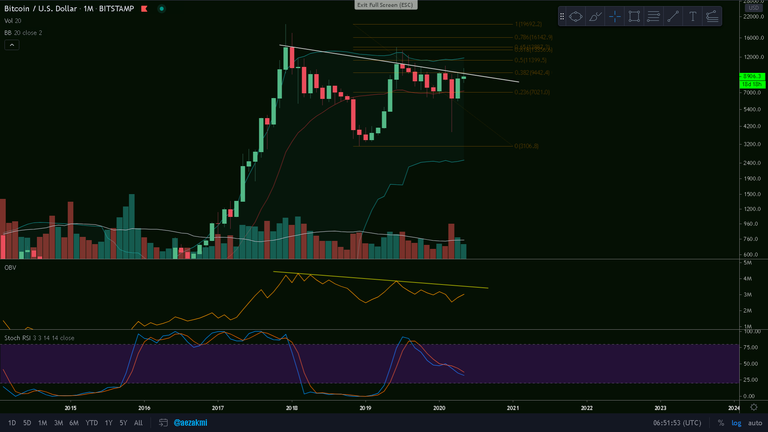
Indicators #2
As if it wasn't enough resistance already, we have the upper band line of the Bollinger Bands also at $11600. The OBV is far from breaking the descending resistance line and usually it does so before the price. The Stoch RSI continues to head lower and a spike to $11500 would probably mean another blue-red rejection. If this specific price action will happen and we get a price rejection at the 11k levels and correct to $5600 in the coming months, the Stoch RSI will reach the oversold area again and perhaps another 60-70-80% green candle will show up afterwards.
Conclusion
Given the situation, I do believe that there's a strong chance to see Bitcoin at $11500 in the following period, but surpassing this level will be difficult, or at least should be. Here is my previous post, where I'm talking about a short position. I would not call this market a bullish one until we close some candles above the previously mentioned level.
P.S: y'all know how this market works: I could be totally wrong and have Bitcoin by tomorrow at 18K :).

Thanks for reading and safe trading!✌
If you find this post useful, please:

Congratulations @aezakmi! You have completed the following achievement on the Hive blockchain and have been rewarded with new badge(s) :
You can view your badges on your board and compare to others on the Ranking
If you no longer want to receive notifications, reply to this comment with the word
STOPDo not miss the last post from @hivebuzz:
Vote for us as a witness to get one more badge and upvotes from us with more power!