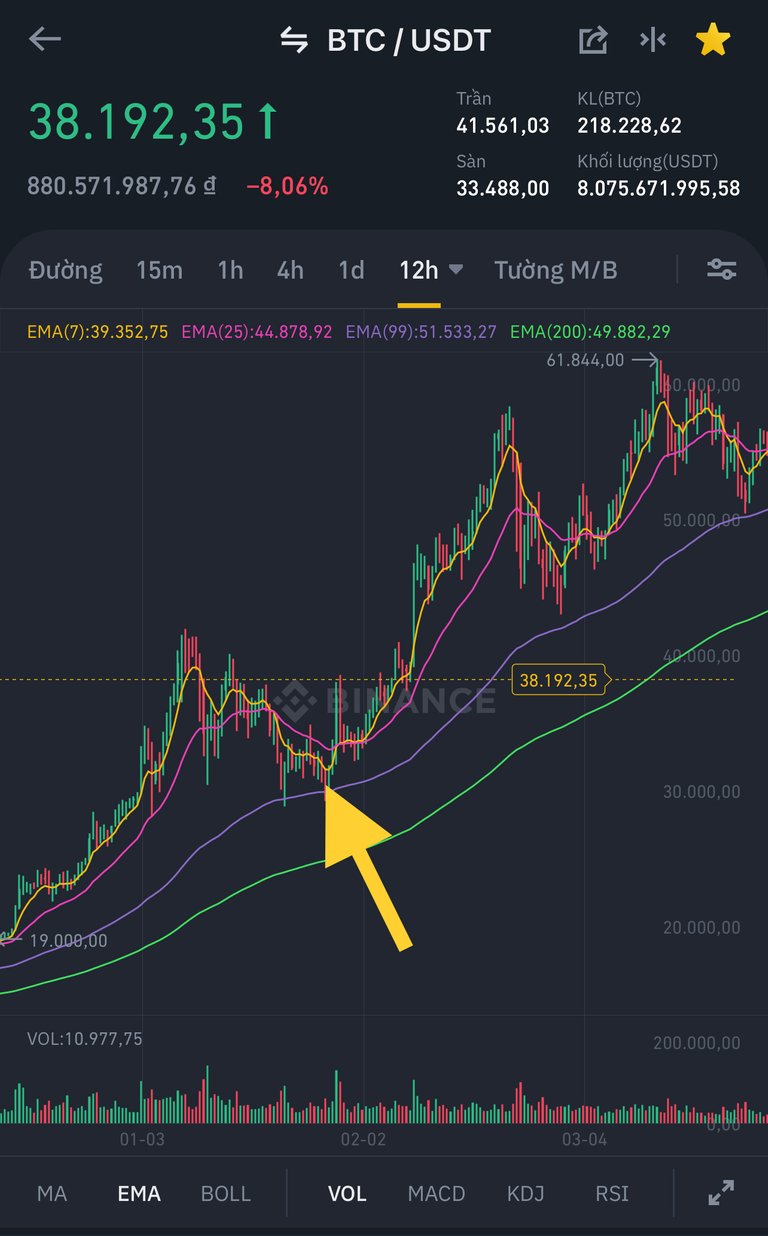
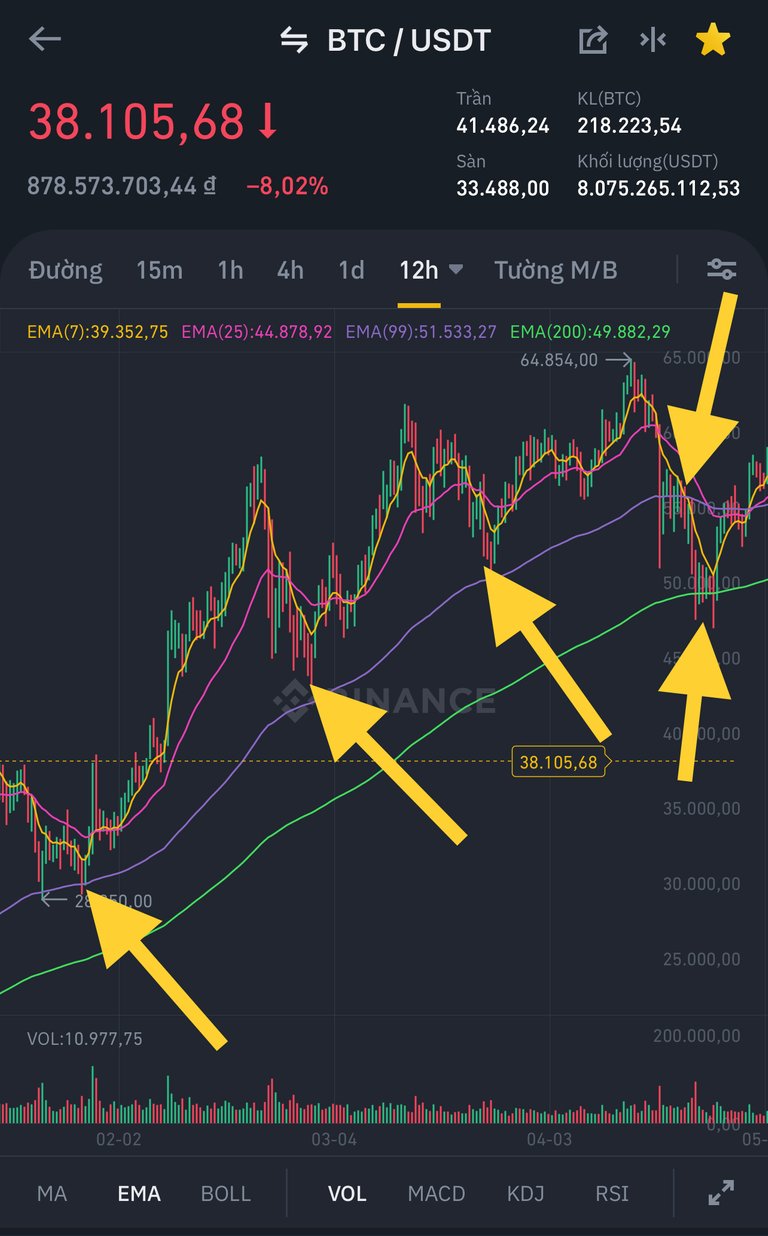
Using BTCUSD 12 hours candlestick pattern with EMA indicator we can realize 99 EMA was a good string to follow BTC price when it was on the bullish side.
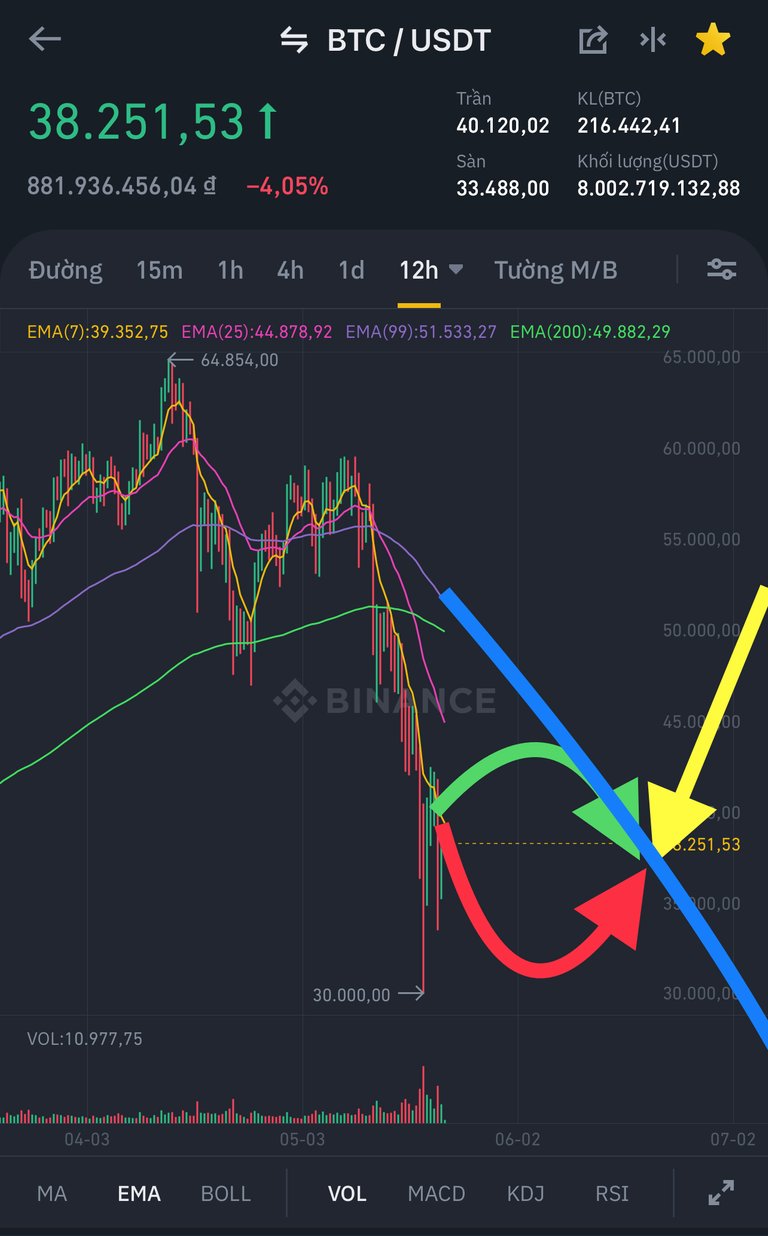
Now BTC price which runs under all EMA lines (25, 99, 200) show an extremely bearish trend.
EMA 99 plays as a good indicator to predict next BTC price movement.
👍
Congratulations @venus2203! You have completed the following achievement on the Hive blockchain and have been rewarded with new badge(s) :
Your next target is to reach 800 upvotes.
You can view your badges on your board and compare yourself to others in the Ranking
If you no longer want to receive notifications, reply to this comment with the word
STOPSupport the HiveBuzz project. Vote for our proposal!