Post number 2 of “The Practical Google Sheets Guide”
These blog posts are part of research I’m doing for a potential new book, hopefully allowing me to further my love for spreadsheets. Theses posts are hoping to provide a practical cookbook of examples to the reader and allow me to learn what people are interested in and how to approach different subjects working with Google Sheets.
TLDR: This post walks you through the steps to create a basic habit tracker. The Google Sheet can be copied directly from the link:
https://docs.google.com/spreadsheets/d/1lRwOKNlrbFqx8g8vx8OUccAXkQC__ugaUAoUfpZXUUo/copy
Creating Habits Through Habit Trackers
Habit trackers are a great way to build a habit and track your progress over time. Building a basic habit tracker in Google Sheets is easy and almost made for spreadsheets. In the following post we will go through a simple habit tracker to track and monitor a potential new goal. I am trying my best to get a certain number of exercises a day, to help me take a break from my work, but you could potentially apply this template for anything.
What You Need To Know To Get This Done?
For todays post, to create our simple habit tracker in not too much time, with some handy features you can bring to a lot of other work you might be doing. In this piece of work, you will need to be able to:
- Add checkboxes to your work and recording the results from these checkboxes
- Use the SPARKLINE to create visualisations to show your progress at a glance
- Use COUNTIF to provide data on the number of checkboxes that have been ticked each week
- Use the SUM function to then generate a basic chart to display a count of your monthly habit totals.
All the functions mentioned can be found at the following reference page, in case you need to double check how the function works: https://hive.blog/hive-163521/@strava2hive/my-google-sheets-function-reference
Setting Up Our Habit Tracker
The following steps will walk you through how to create the habit tracker on your own Google Sheet, but of course we always have a template for you to use, if you need it quicker.
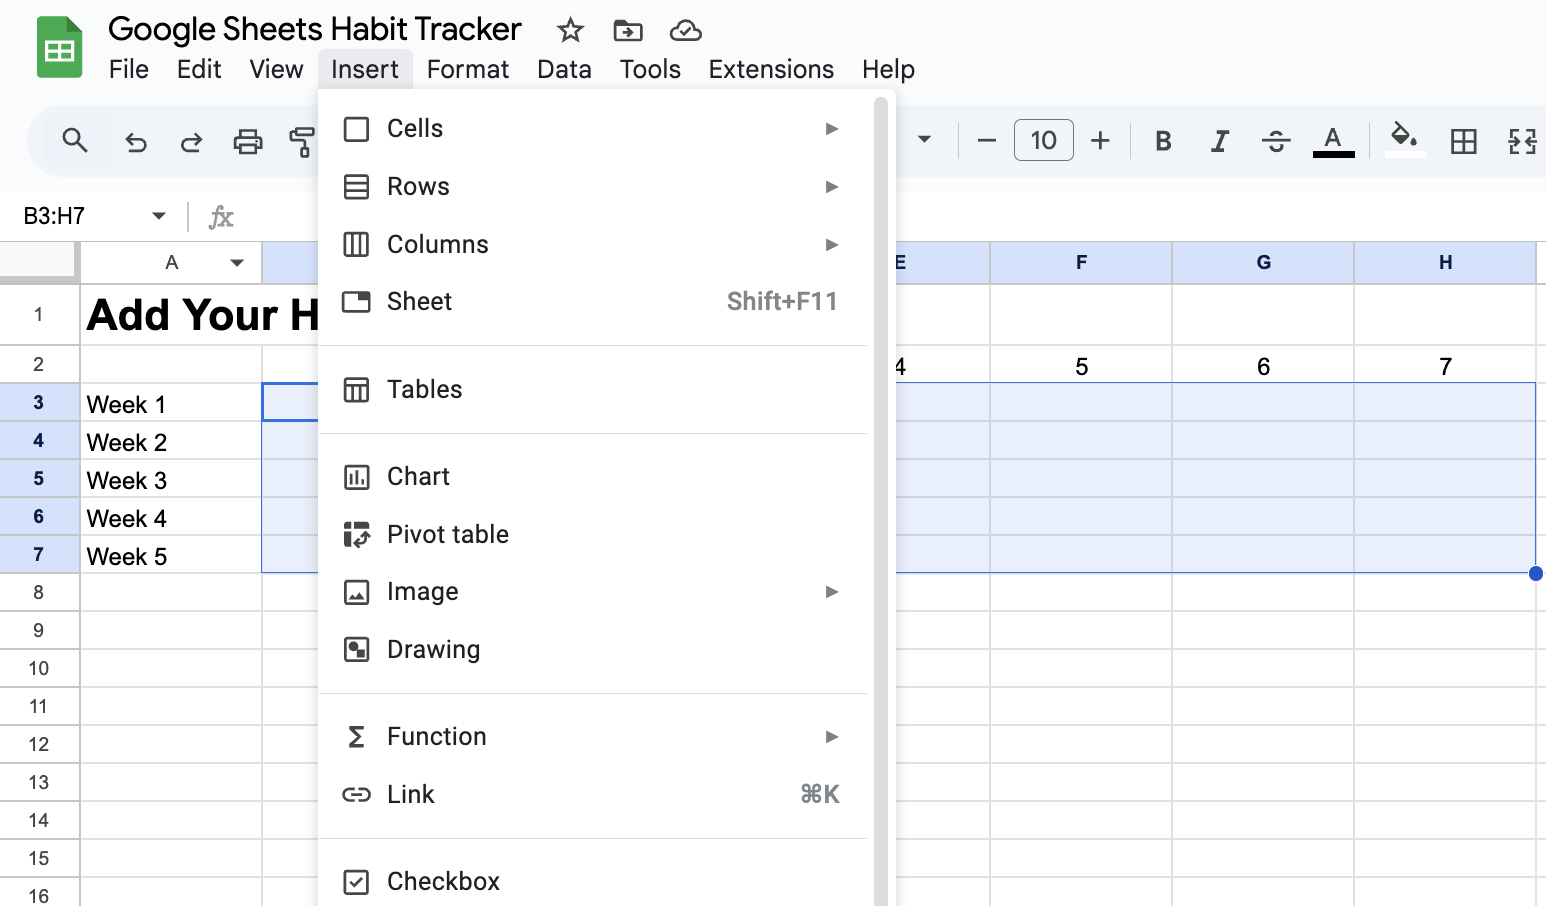
1.Start by setting up the basic format of the habit tracker. In my example, I have set up a 5 week habit tracker, where I have created a checkbox for each day of the week.
- Set up the main heading in the A1 cell and format it to bold and a larger font size
- Have your weeks running from cell A3 to A7, in the example below, I have 5 weeks listed. Across the top in row 2, I have the number of days running from 1 to 7.
- Add the checkboxes, by highlighting the area range from B3 to H7 and select “Tick Box” from the Insert menu.
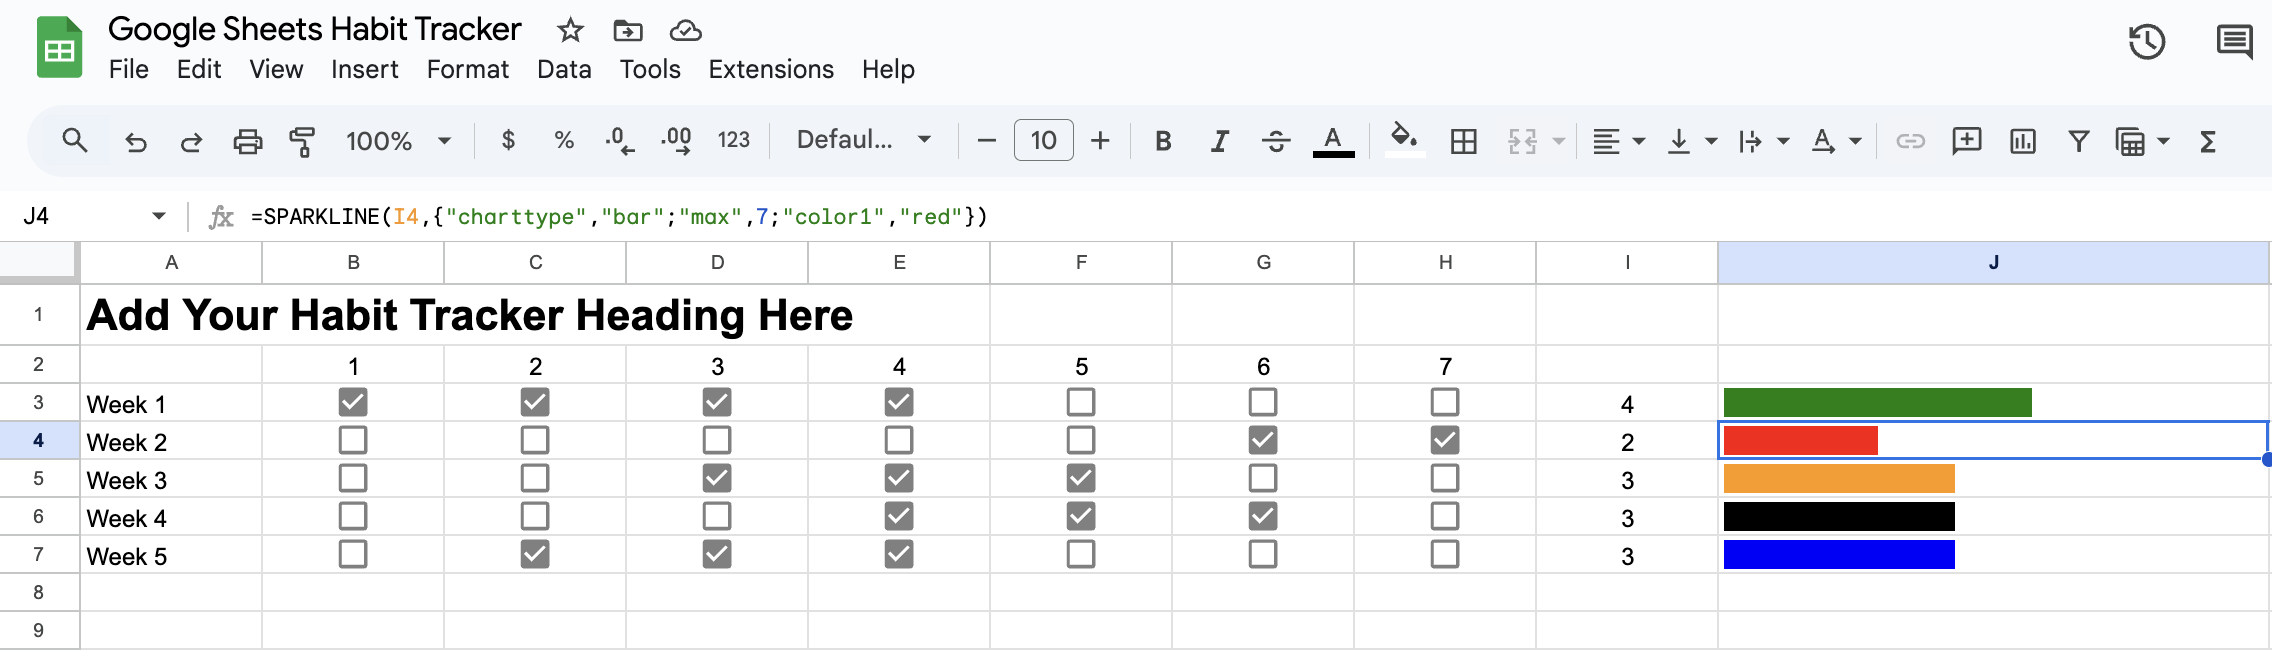
2.We can now set up a count for each week and a progress bar to allow us to see a visual progress for each week.
- We add our COUNTIF function in cell I3 as a count of the checkboxes from B3 to H3, and only if the value of the checkbox is “TRUE”:
=COUNTIF(B3:H3,TRUE) - Copy this formula to the rest of the cells in column I
- Add a sparkline with the formula to display the data visually in I3. This formula will be in cell J3 as a bar charttype in the form of:
=SPARKLINE(I3,{"charttype","bar";"max",7;"color1","green"}) - Copy the SPARKLINE formula to the rest of the cells in column J. In the image below, I have set the “color1” option to a different value for each week
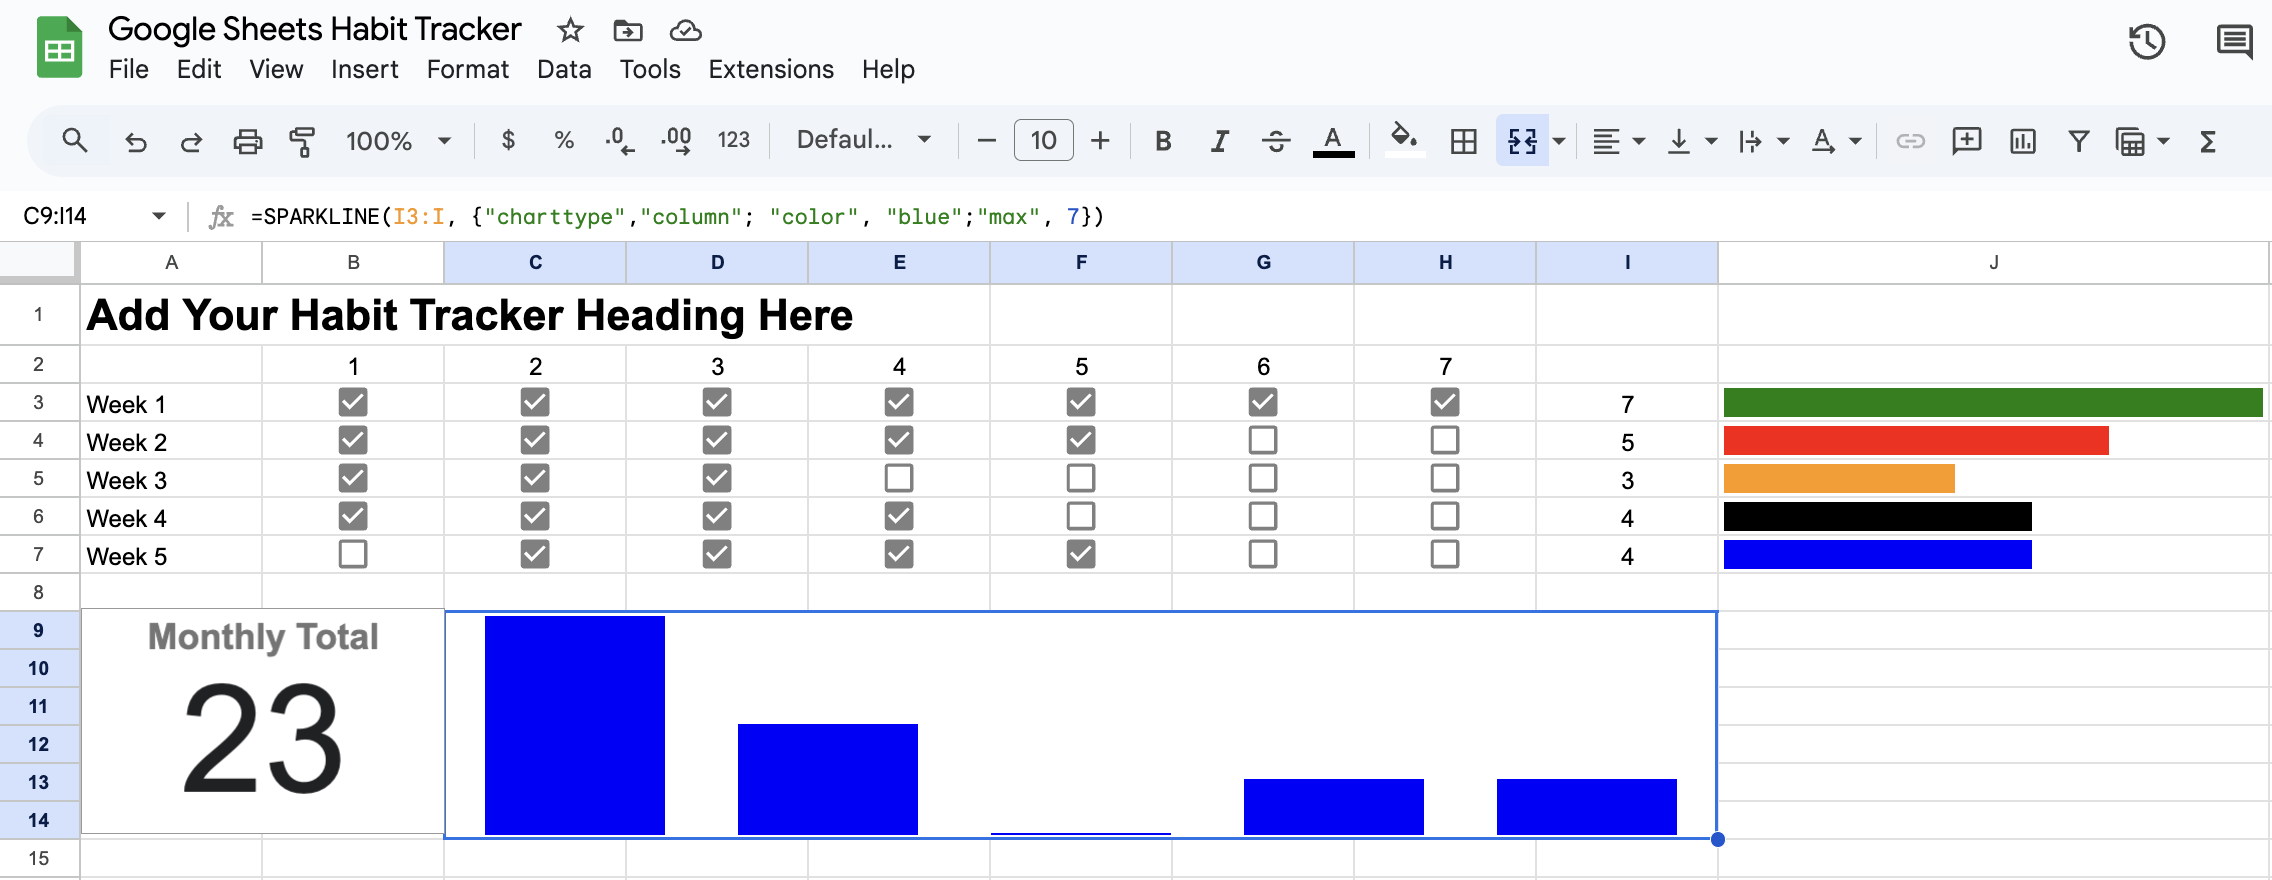
3.We can now create some extra visualisations at the bottom of the habit tracker. In the final image, we have a single value chart showing the total of the entire habit tracker, as well as a column chart showing the totals for each week.
- The value for the single value chart will be copied over, and in my example I have added it to the A10 cell. This will be a simply SUM of the values in column I as:
=SUM(I3:I7) - We can now add the chart to the sheet by selecting the A10 cell and select Chart from the Insert menu. Select a “Scorecard Chart” from the types menu, and name the chart as “Monthly Total”
- For the column chart, we could do something similar to the previous step, but instead we will us another SPARKLINE. We can start by merging the cells by select cells C9 to I14 and selecting “Merge Cells” from the Format menu. Then select “Merge All”
- Then add a SPARKLINE to the merged cell, using the values in column I as
=SPARKLINE(I3:I, {"charttype","column"; "color", "blue";"max", 7})
This was a great and quick little tutorial. We started with a blank canvas and set up a basic format for the habit tracker, in an easy to use and follow format. We added in checkboxes for the user to track their habits daily. We added in formulas to help visualise progress, including the use of Sparklines, with a totals chart to see overall success.
About The Author
The post is written by Vincent Sesto, a Aussie Software Engineer, living and working in Auckland, New Zealand. If you are interested in my authors page on Amazon, feel free to checked it out at the following link: https://us.amazon.com/stores/author/B073R3VW2G
I never knew you had published a series of books on docker virtualisation, we use Ansible at work… I’ll try out the spreadsheet template, could be handy for a couple of things, including posting regularly on hive.
Hey @nicklewis yeah have a couple of books under my name but kinda unsure if I'll publish again with everything that is happening around AI...guess we'll see. Thanks for your nice comments and let me know if you have any questions
I shall do indeed. Do you feel that AI negates the need for books or are you concentrating more on it as a topic/tool in your own day-to-day career? I am intrigued, as being a software engineer also, it has caused a bit of a stir, a lot of thought in terms of "How will this effect my career going forward" - Sorry going well off topic here and something I might write about in a post.
No it's a really good discussion. I think AI is going to effect everyone's work but I think in a positive way, so I think it is good for everyone to start to embrace it, even in small steps like using copilot or a code assistant. With regards to publishing, unfortunately you do need to compete with a lot of bad writing, and AI is making it easier for people to create this content a lot quicker which I have seen has made an impact on the book publisher's themselves...these companies seem to be pivoting with the tech, but unsure as to how things will work in the future. The technology is moving really fast.
I agree on the positive side and have found copilot to be invaluable for me of late, especially working with some newer frameworks recently. I’ve also set up a local Ollama instance that I’ve linked to LogSeq for a smart note taking experience. I’ll do a write up on it, as it’s proving to be really interesting. I’ll set up something similar for obsidian too, as I’ve used it for documentation and research tasks.
Awesome, sounds like you are getting your hands nice and dirty with AI, especially using ollama...I just started looking at it the other day, it's pretty awesome to be able to run such a powerful tool from your laptop. I'd be interested to see some of your work as posts to Hive.