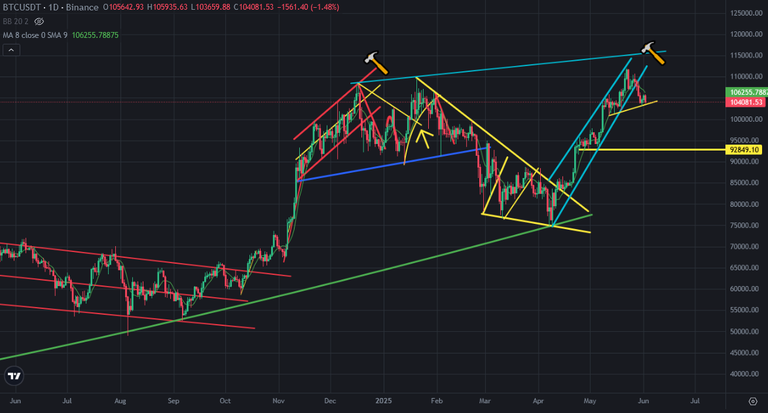
There is mini support line on Bitcoin price chart at 104K USD level. It may be a head and shoulders pattern. I shared an analysis about this possible pattern. It is appearing day by day. Today Bitcoin price is trying to break down mini support line. When it breaks down, we will see head and shoulders pattern and We will focus the price target of this pattern.
Here you can see daily chart of Bitcoin price. Bitcoin price got huge red candle after three small green daily candles. It may be trying to draw the right shoulder of head and shoulders pattern.
Here you can see the indicators on daily chart of Bitcoin. Bitcoin is trying to draw new pattern on RSI Indicator. We may see the new big bowl pattern on RSI Indicator. Even Bitcoin may break down mini support line, Fisher and MACD Indicators seems close to reverse up. Fisher Indicator is on the bottom. It may reverse up. MACD Indicator is in correction. It may reverse up in a few days.
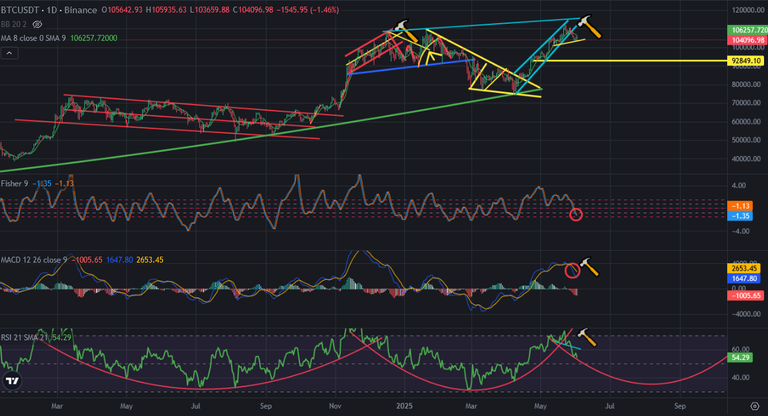
So, we may see soft price correction on Bitcoin price chart. The height of head and shoulders pattern may be price target for price drop after breaking down mini support line.
If it happens, we should follow the height of price drop.
We will see..
Posted Using INLEO
Crees que rompa a la baja @chorock, yo tengo una orden para activar en los 103.100 en bitcoin para el alza, que no se activó. Tú crees que ya empiece el bear.
Saludos bro y excelente lunes 😊😉🤝