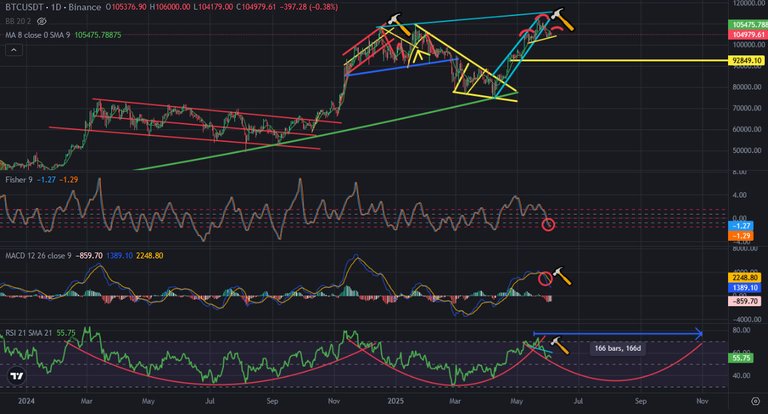
8-Day moving average shows us the trend for short term. 8-week moving average shows us midterm trend. After touching 112K all time high level, Bitcoin price went down under 8-day moving average and this is 9th day of being under this average.
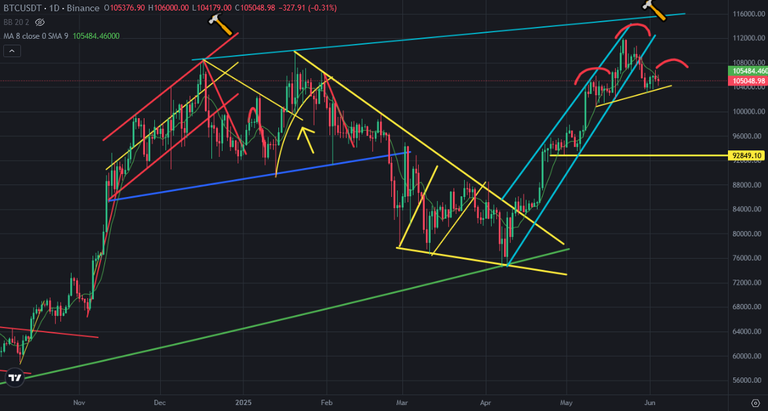
Here you can see daily chart of Bitcoin and 8-day moving average. Bitcoin price resisted by 8-day moving average for short term. It is important to see breaking up. If not, we may see head and shoulders patttern. The price target of possible head and shoulders pattern is 94K.
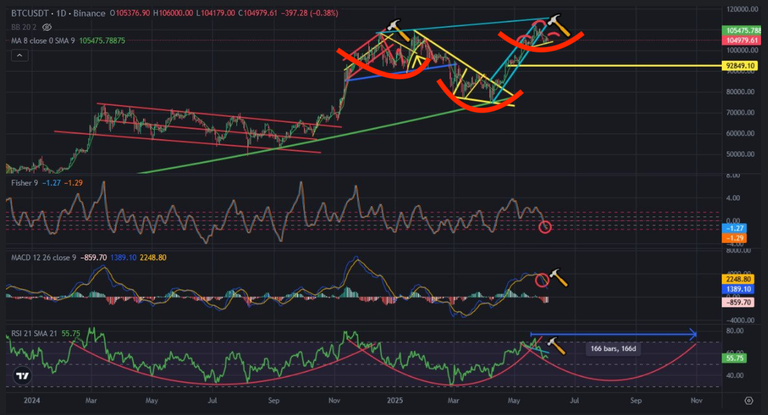
Here you can see the indicators on daily chart of Bitcoin. Even Fisher Indicator is trying to reverse up from the bottom, Bitcoin price can not go up. We may see another price dump on Bitcoin price chart. There is big bowl pattern on RSI Indicator. We may see another touch to the bottom of this pattern if we see price dump on Bitcoin price chart in short time.
When we look at big bowl pattern on RSI Indicator, we may see the bottom in August and we may see the top in November. We have seen same pattern on RSI Indicator. We may see it again.
It is possible to see another big bowl pattern on RSI Indicator. So, we may be in downtrend for short term until August. I will focus about this possible bowl pattern on RSI Indicator.
We will see..
Posted Using INLEO
I don't know, this could be like a giant inverted head and shoulder too, will have to wait and see.