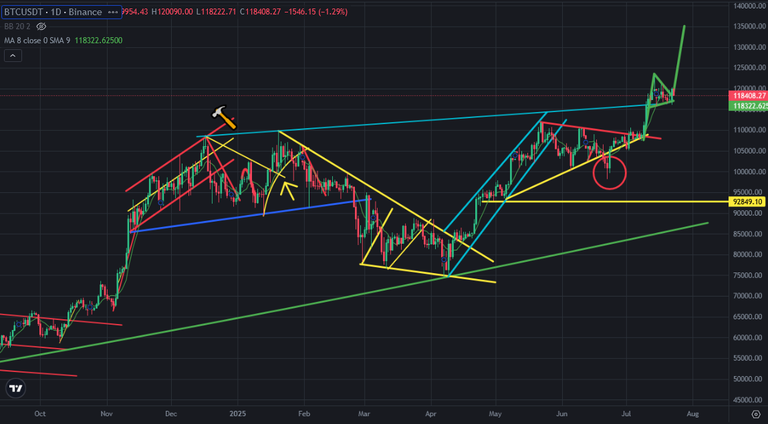
There was flag pattern on Bitcoin price chart. After touching 122K, Bitcoin price pulled back to 118K to complete flag pattern. I shared a few analysis about this flag pattern and It is broken up. Even Bitcoin price broke up this flag pattern, Bitcoin price can not go up.
Here you can see daily chart of Bitcoin and my draft. The target of flag pattern is to touch 135K USD. After breaking up the top line of flag pattern, Bitcoin price got huge daily candle. After this daily candle, Bitcoin price is trying to go up but It can not. It is still on 118K USD level.
Here you can see the indicators on daily chart of Bitcoin price. MACD Indicator is so close to touch great resistance. This is why It can not go up. It reversed down a few days ago and it reversed up again. But it can not go up fast as past. Fisher Indicator completed correction. It can reverse up from this level.
There is negative divergence on daily chart of Bitcoin price. The top levels of RSI Indicators are getting lower. This is why we may see possible price dump on Bitcoin price chart to complete correction of this negative divergence..
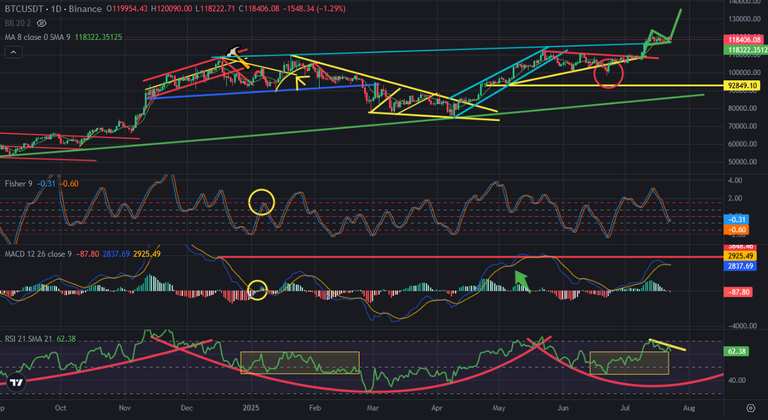
Even there was bullish flag pattern, we may see price correction on Bitcoin price chart. A few indicators touched the resistances.
We will see..
Posted Using INLEO
I'm waiting for you to make a price prediction for hive token 😔 This is disappointing as I see it mostly in the case of Bitcoin.
Bitcoin can go up!