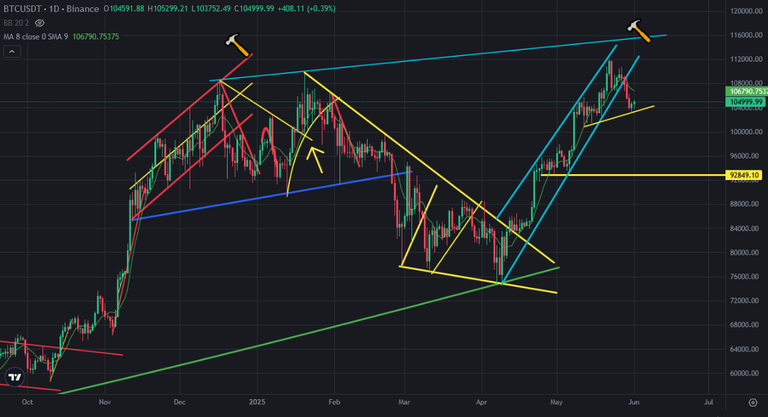
Bitcoin price entered price correction after touching 112K USD. We had not seen this price correction from 76K. So, It may not be a small price correction. Because Bitcoin price went up 50% without any price correction. This is the first price correction after 50% price pump.
Here you can see daily chart of Bitcoin price. Bitcoin broke down mini uptrend line. This is why Bitcoin price went down. It is supported at 103K USD level. It may be the right shoulder of possible head and shoulders pattern. We may see right shoulder in next week. If we can not see higher top on Bitcoin price chart, head and shoulders pattern may start.
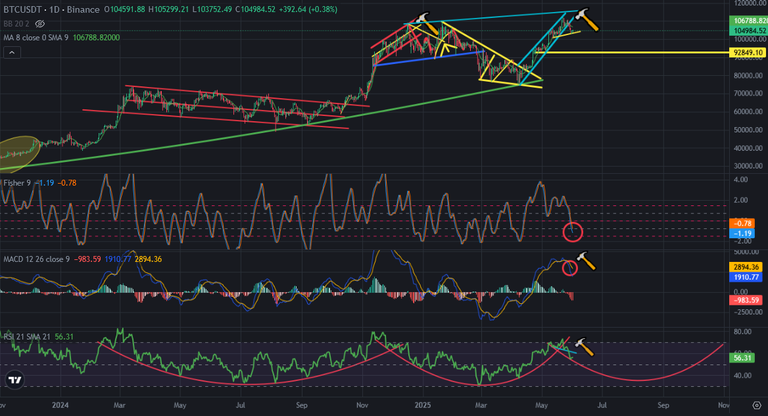
Here you can see the indicators on daily chart of Bitcoin price. There were bowl pattern on RSI Indicator. Bitcoin completed the second bowl pattern on RSI Indicator. This is the beginning of third bowl pattern. After price correction, RSI Indicator touched the possible bottom of bowl pattern on RSI Indicator. MACD Indicator reversed down from the top. So, Bitcoin price may go down to bottom of RSI Indicator for mid-term.
If we see the right shoulder of head and shoulders pattern in next week, we may see another price drop in June. We may touch the bottom of possible bowl pattern on RSI Indicator in August..
''Sell in may go away'' motto delayed. Market Maker may sell in June and go away.
We may not see volatility days during Summer.
We will see..
Posted Using INLEO
Congratulations @chorock! You have completed the following achievement on the Hive blockchain And have been rewarded with New badge(s)
You can view your badges on your board and compare yourself to others in the Ranking
If you no longer want to receive notifications, reply to this comment with the word
STOPCheck out our last posts: