Hello @Leofinance community, I have been educating myself about technical analysis and investing in the financial markets for some time now, this has led me to try many indicators and strategies without getting something that I feel really comfortable with when making important investment decisions. However, when I tested and analyzed in detail the MACD and all the range of options it offers, I found it to be one of the best indicators that exist for trading in the market. Based on what I learned, I want to bring to the platform all about this indicator, join me.

What is simply the MACD indicator?

Image Google Source
The MACD is a multifunctional indicator, which allows you to identify the formation and reversal of a trend, in addition to this, thanks to all the components that it has, we can also observe the strength of a trend regardless of the temporality that we work at any given time. Also the MACD, is composed of several elements that make it a very versatile, flexible and easy to master indicator, this makes it very effective when trading, as long as we know what we are doing and of course, fulfilling all the rules to be successful.
Among the components that it has we have:

MACD Line: This line is composed of two Exponential Moving Averages (EMA) of 26 and 12 periods, where the subtraction of these two, form in itself, the MACD line that is represented in the graphs commonly in blue color.
Signal Line: This line is composed of a 9-period Exponential Moving Average (EMA), which is commonly represented in the charts by a red color. Like the MACD line, this is of vital importance and gives as a reference the main reversal signals in conjunction with the MACD line.
Histogram: The histogram is a very important tool that has the MACD indicator, this can reflect in it, the strength that has a trend, it can also give us very good signals even before the MACD and signal lines can give us investment signal in any financial asset.
The Zero line: This line represents the center of the MACD indicator, it is a very important component in it, since, depending on the extreme of the MACD and signal lines, it can determine which is the current trend of the asset. In addition, it can give signals of reversal and/or continuation of a trend just when it interacts with the MACD and signal lines.

Is the MACD indicator good for trading cryptocurrencies?

Image Google Source
Of course, this is an indicator that adapts perfectly to the cryptocurrency market because it has very sharp changes in the price, which brings as a consequence, a high volatility in it. In addition, I commented that this indicator adapts to any time frame that we want to work, making it perfect for identifying both general and secondary trends, which allows this indicator can be used by any type of trader, either a "Scalper", wanting to get very quick profits, an investor "Intraday", which focuses on obtaining profits the same day or the "Swing" type traders who only care about investments that last days, weeks and / or months.

Which is better, MACD or RSI?
It is a complicated answer, however, in my opinion, due to the amount of signals that the MACD can offer, the latter seems to me much better, of course I do not want to discredit everything that the RSI shows us, but sincerely the MACD, for its versatility and flexibility, offers me many more investment opportunities than the RSI itself. Besides, in any seasonality we can obtain very good information.

How to add the MACD indicator to the chart, what are its settings and ways to benefit from them?
In order to add the MACD indicator to our chart, it is very simple, we just have to follow a few steps to fully access what this fabulous technical analysis tool offers us.
- Step 1
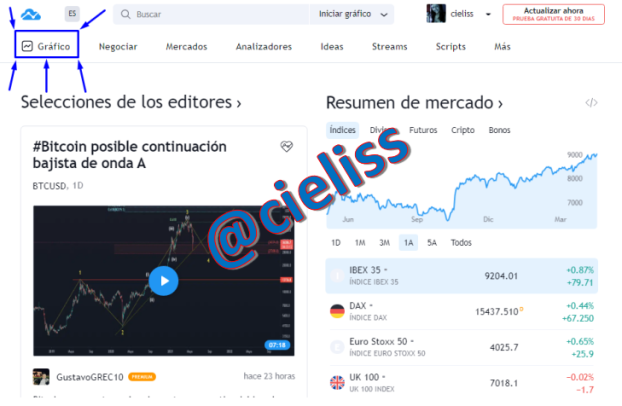
The first thing is to go to the "Tradingview" platform, which is the platform I use to access the charts and perform my technical analysis and monitor my investments. To enter the platform Click HERE

Screenshots of Tradingview
- Step 2
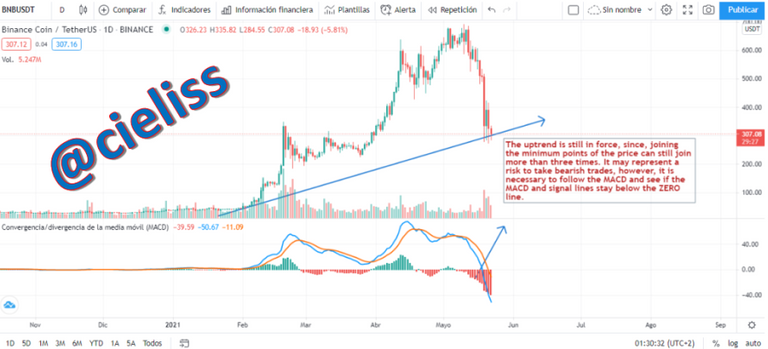
The second thing we must do, is to go to the top left of the graph, there we will find a box to choose the asset that we want to analyze, in this case, as we are in a Crypto academy, I will analyze a cryptocurrency and the one I chose is the "BNB", which I will use in all the examples of this publication. Subsequently, when we click on that point, we will see a search engine, there we click and we will see a pop-up window to select and / or search for the one we want. Select and ready, we will be in our graph.

Screenshots of Tradingview
- Step 3
The last step is to enter the MACD indicator to the chart, for this, we will look for the option of indicators just at the top of the screen, once located, we click there and it will throw us a pop-up window, where we will place in the search engine, the name of our indicator which is MACD. Select it and that's it, we will have it added.

Screenshots of Tradingview

what are its settings and ways to benefit from them?
There are several essential configurations in this indicator that will allow us to execute buy and sell operations in the market. So, to know these configurations and to know what benefits we will be able to obtain, pay close attention:
- Crosses of the MACD line with the SIGNAL line
This is if you will, is the main configuration that we can use with the MACD. Its operation is very simple, we only have to wait for a crossing between these two lines to be able to execute a purchase or a sale in the market. In this sense, if we are looking for a "Buy" operation, we must wait that, in the lower pole of the graph, the MACD line crosses from bottom to top the signal line, this will indicate that a new uptrend can start, we must also be very aware that the MACD line (Blue), is above the signal line (Red), for this entry to be valid.

Screenshots of Tradingview
- Crossing of the MACD lines and the Signal line, with the ZERO line
Another of the configurations that we will be able to use, is the famous crossing of the lines of the MACD and signal, with the average line (ZERO) that our indicator has. Its operation is very simple, we only have to wait until after these execute their usual crossing, commented in the previous part, these must simultaneously cross the ZERO line, giving us another signal of entry to the market in the direction that we are working. We must take into account something, this signal is more delayed than the others, but we can interpret it as, the movement we are seeing has more strength.

Screenshots of Tradingview
- The Histogram and its benefits
The histogram is another tool that we can use to our benefit. Its operation is very simple and can provide us with one of the best signals that, in my opinion, this indicator has, since it basically comes before all the others. The histogram shows us green and red bars, depending on the direction that the price has at that moment, these represent the strength of the movement, then, while a movement is becoming stronger, it means that the bars grow in size and the opposite happens if the movement weakens, since the bars tend to decrease in size. When we can identify that a movement is weakening, this can give us a clear signal of reversal, because it is warning us that the price may be turning around, which can allow us to enter before it happens, something that happens before the conventional crossing of the MACD and signal lines.

Screenshots of Tradingview
- Trading with the MACD divergences
The last configuration that we can use with the MACD, is that, we can identify the famous divergences. It may often be difficult to find such signals, but if we sharpen our eyes on the chart, we can realize the details that does not leave the price and then, we can enter a trade having the odds in our favor. In this sense, in order to identify a divergence, we only have to look at our chart, if, for example, the asset we are analyzing has an uptrend and is making higher and higher highs and we look at the time our MACD and see that our MACD lines and signal, are making lower and lower lows, this means that the uptrend is weakening, so the best chance is that the price is reversed and this may be the signal for us to invest in the opposite direction and take advantage of this movement.


Bullish and bearish MACD divergence - Screenshots of Tradingview

How to use MACD to cross the MACD line and the signal line, and how to use MACD with the zero line crossing?
Using the MACD in these two configurations is very simple and easy to understand, even for me that I am still in the process of learning in this profession called "Trading". To understand how we can enter trades in buy or sell with these forms pay close attention:
MACD Crossing with the Signal line.
To enter Buy: To be able to enter purchases with this configuration, we only have to wait for a new trend to form in our asset. To be able to identify this, we must only be attentive to the lower end of the MACD, since, at this point we must wait for a crossing of the MACD line (BLUE), with the SIGNAL line (RED) from bottom to top, when this happens the MACD line must be above the Signal line, confirming that a new uptrend has formed and, therefore, we enter bullish.
To enter Sales: To enter sales with this setup we should expect absolutely the opposite of the previous point. In this sense, we will look for "Sell" when the MACD lines (BLUE), crosses the SIGNAL line (RED) from top to bottom, when this happens the MACD line must be below the signal line, ratifying that a new downtrend has formed and, therefore, we enter to the downside.
MACD and SIGNAL line crossing with the ZERO line.
To enter BUY: To enter buys based on this setup, we only need to keep an eye on the MACD and signal lines. Generally, these lines cross according to what I explained above giving a reversal signal, however, if in a certain way we could not buy at that point, but we want to take advantage of the complete movement and not lose it, we wait for the MACD line and the signal line to cross simultaneously from bottom to top, this will give us another signal that the trend still has strength to continue and join the upward.
To enter Sales: To enter sales based on this setup, we must do the opposite of the previous point. As I said, we must also be aware of the MACD and SIGNAL lines, since these lines cross as explained above, then we have that the MACD and SIGNAL lines come from the upper end and if we do not take advantage of entering this crossing, we must only wait for the downtrend to take more strength and both lines simultaneously cross the ZERO line, this will be another signal to invest downward just when this happens.

How to detect a trend using the MACD?
Detecting trends with this indicator, is another of the many utilities that I have already discussed above. Although I will be very specific at this point, since my research led me to the fact that there are only a few ways to do it and take advantage of it so that we can benefit from it. In this sense, trends can be formed in many temporalities and we can always see that these are different depending on the temporality we are working with. Based on this, I will detail how to do it:
Crossing of lines: The famous crossing of the lines that I have already commented in the past, is a way to detect the new trends that the price is forming, in the different temporalities that we work.
The lines above the ZERO line: Another way to detect an ongoing trend and not since its inception, is to observe when the MACD lines and the SIGNAL line are above the ZERO line and also manage to stay for a certain time above it. This means that the trend is maintained and is strong.

Screenshots of Tradingview

How to filter the false signals?
To filter the false signals, I have my own ideology or if you can say, strategy, of how to do it, since, in itself the indicator does not have a tool that allows us to filter the signals that we should not take and those that very possibly would go against a well-defined trend. So to identify these false signals we must take into account the following:
Use moving averages or another oscillator that allows you to identify trends: The moving averages can allow us in any temporality, to filter a trend, if we are not quite sure of the strongest direction that the price has. For example, we can use a "SMA" of 350 periods, and determine on which side the price is, if it is below the moving average, the trend is bearish if on the contrary it is above it is bullish. In this sense, in either of the two scenarios, we will only take the MACD signals that are in the direction of the dominant trend.
The higher the time frame the more reliable: Another technique that can be very useful, but that is only made for traders who have patience, is to use higher time frames, these time frames will allow us to easily observe the general direction of the price and we should only take MACD signals that are in the direction of the general trend.

False signals filtering with moving averages - Screenshots of Tradingview

False signals filtering with higher temporalities - Screenshots of Tradingview

How can the MACD indicator be used to extract points or levels of support and resistance on the chart?
Using the MACD, in order to identify support or resistance, is very useful and simple and we just have to take into account certain aspects, to be able to refine our view and determine these points on the chart. To do this we must only follow the recommendations that I will describe below:
- To observe carefully where the MACD and SIGNAL lines, make a reversal and then return to touch the same point, preventing the lines to move in one direction or another. To be clearer, is to observe the path of these lines and determine at which points it turns around, once this is done, we go to our chart and the price should be being held back by an area, which the price (Japanese Candlesticks), has not been able to cross. This approach must be simultaneous, both in the chart and in the MACD indicator, with this we will realize if it is a valid support or resistance to take into account.

Valid supports - Screenshots of Tradingview

Valid resistances - Screenshots of Tradingview

Review the chart of any pair and present the various MACD signals
In this last question, you can observe, how all MACD signals are presented in the same currency, for this example I use the cryptocurrency called Binance Coin (BNB).


All Signs Together - Screenshots of Tradingview

Conclusion
The MACD is really a flexible indicator and very easy to use, it really has a number of benefits for our operations, besides adapting to all types of investors. I hope this information related to one of the most incredible indicators that I have tested, is to your liking, my intention, as I have already said, is to bring real financial content that helps all new users to understand the entire ecosystem related to finance and of course, with cryptocurrencies.
To all of you thank you very much for your attention.

Join the official community here Discord
Posted Using LeoFinance Beta
Excellent content
@tipu curate
Upvoted 👌 (Mana: 11/22) Liquid rewards.
Congratulations @cieliss! You have completed the following achievement on the Hive blockchain and have been rewarded with new badge(s) :
Your next target is to reach 7000 upvotes.
You can view your badges on your board and compare yourself to others in the Ranking
If you no longer want to receive notifications, reply to this comment with the word
STOPCheck out the last post from @hivebuzz:
Support the HiveBuzz project. Vote for our proposal!
Congratulation
Posted Using LeoFinance Beta
Thank you
Posted Using LeoFinance Beta
An excellent guide to the MACD indicator!
Looking forward top reading more of your content here within the LeoFinance community :)
Posted Using LeoFinance Beta
Hi @forexbrokr, glad you liked it. It is an indicator that I really love to use while trading my assets.
Posted Using LeoFinance Beta