Originally posted in Leo finance:
https://leofinance.io/hive-167922/@cryptojournalist/the-4-most-profitable-cryptocurrency-trading-indicators
Finding the right mix of indicators for crypto trading is no easy task. There are many options to choose from and knowing how they work together can complicate matters even further.
Fortunately, however, there are groups of indicators you can use on most exchanges that work well together and can help you make more profitable decisions. These indicators are also easy to use by even beginner traders.
In this post, we'll cover what these trading indicators are and why they work. Next, we'll cover how to use each one in detail, such as the Volume Weighted Average Price (VWAP), SuperTrend, Relative Strength Index (RSI), and the Average True Range (ATR).
1. VWAP
The VWAP is a unique indicator as it uses both the cryptocurrency's price as well as volume as part of its calculation. The line moves up when there is more volume and higher prices and moves down when there is less volume and lower prices.
A VWAP is calculated by multiplying the price by the crypto's volume and then dividing by the total volume traded.
Like other moving averages, the VWAP can be used across any time scale, including 1-minute to yearly charts.
As the indicator takes into consideration both price as well as volume, it is effective for determining the direction as well as the strength of the overall trend.
.png)
To put the VWAP into practice: when the crypto is trading above the line it is a sign of strength. If the coin trades below the line, it is a sign of weakness. The line can also be tested as a level of support and resistance.
You may choose to place your stops above the VWAP or slightly below it. It is generally not recommended to use the line as your stop-loss zone as it is a common area to stop people out of their trades.
The best practice is to use the VWAP as a confirmation signal that the market is moving in your favor. You can use it for going both long and short, which makes it a versatile indicator.
2. Supertrend
The SuperTrend is a trend-following indicator that helps you to identify long and short entry positions during trending markets.
The indicator uses true ranges and a multiplier for creating the green or red lines above or below the price action. Default settings for the SuperTrend is a 10-period true range multiplied by three.
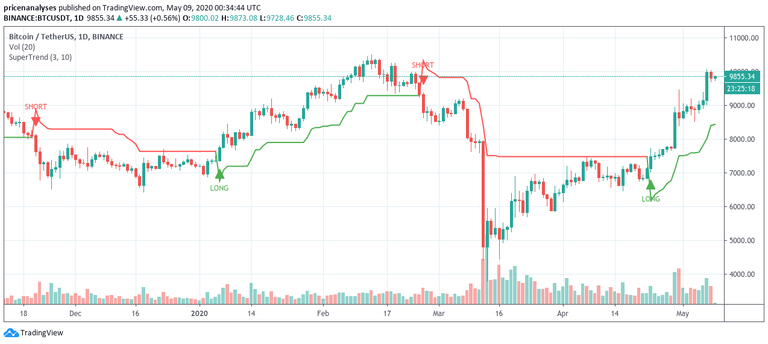
There are three uses for the SuperTrend.
First, the colored lines show when the price changes from a bullish to bearish trend. Second, the indicator gives precise entry and exit signals to help you better time your trades. And lastly, the lines themselves can be used as stop-loss zones in case the price moves against you.
3. RSI
The RSI is a momentum indicator. It shows the strength of price changes and identifies overbought and oversold conditions. A core feature of the oscillator is that it moves up and down along with the price action, with its movements directed by the average percentage gains or losses over its look-back period.
As an oscillator, the RSI moves between 0 and 100. A reading of 70 and above indicates an overbought market, while a reading 30 and below indicates an oversold market. When the indicator moves into these extreme areas, it's likely that the currency will experience a pullback or correction that will move the RSI towards the neutral reading of 50 on the indicator.
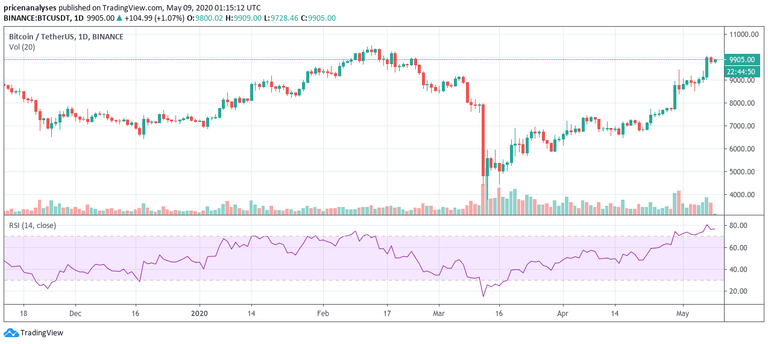
The simplest method of using the RSI is to spot for oversold and overbought market conditions. For example, buying bitcoin while it's oversold is a buying signal that could lead to substantial gains.
Another strategy is to trade around divergences between price and the RSI. When price moves higher, but the RSI moves lower, this is called a bearish divergence, or a clue that the trend may soon reverse. You may also see bullish divergences when prices move lower but the RSI turns higher which has the inverse interpretation.
4. ATR
The ATR is a volatility indicator. Plotted as a line beneath the price, it gives a visual and numeric value of the average price movement of cryptocurrency over its look-back period, which in this case is 14 days.
You can see this, in the below chart as bitcoin's ATR is $456.25 which means, on average, bitcoin's price moves $456.25 each day in either direction.
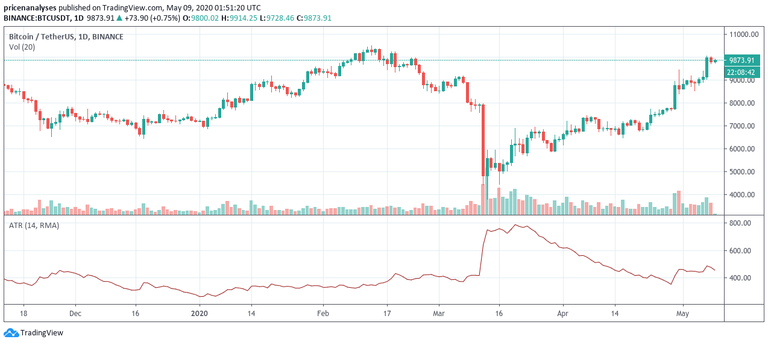
The main use of the ATR is to set both stop-losses and profit targets. By anchoring these levels with the average rate of change on the cryptocurrency you can better estimate and control your positions.
Some traders like to double the figure of the ATR and set it as their stop-loss. So bitcoin's stop-loss, in this case, would be set $925.50 below the entry price. The take-profit level could then be extended to 2.5x the ATR to ensure a positive risk-reward ratio, which is vital for long-term success in the markets.
Conclusion
Picking the right indicators can be tricky that work with crypto can be tricky. But some have proven to work well in this volatile market and can help increase your number of successful trades.
If you have any thoughts or questions about profitable trading indicators feel free to comment below!
Hi! I am a robot. I just upvoted you! I found similar content that readers might be interested in:
https://www.investopedia.com/articles/active-trading/042114/overbought-or-oversold-use-relative-strength-index-find-out.asp
Congratulations @cryptojournalist! You have completed the following achievement on the Hive blockchain and have been rewarded with new badge(s) :
You can view your badges on your board and compare to others on the Ranking
If you no longer want to receive notifications, reply to this comment with the word
STOPDo not miss the last post from @hivebuzz:
Vote for us as a witness to get one more badge and upvotes from us with more power!