How is the Ethereum network doing these days? The market peaked back in April 2024, and these days the prices are down.
Since the PoS update the inflation for Ethereum is reduced by 90%, from 4.3% to 0.43%. Additionally, part of the ETH for transactions is burned, that pushed Ethereum into deflationary territory. Meanwhile, the share of staked ETH kept on growing drying up the liquid ETH supply.
Let’s take a look.
Here we e will be looking at:
- Overall Supply
- Number Of Wallets
- Active Wallets
- Transactions
- Fees
- Staked ETH
- Contracts
The data presented here is mostly gathered from the etherscan charts and Dune Analytics.
Supply
The overall supply now looks like this:
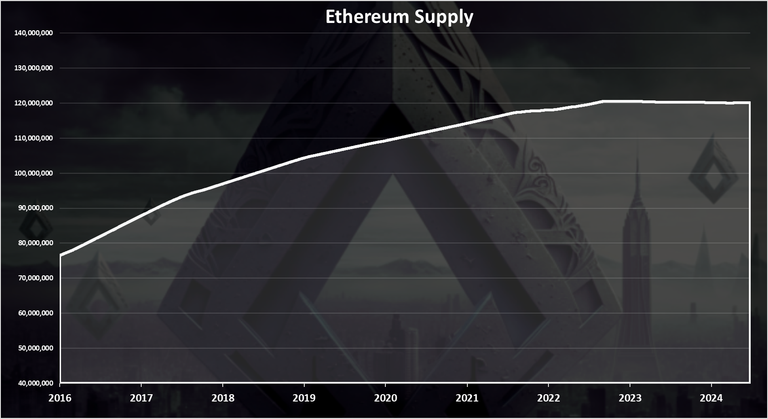
A steady increase in the supply from just above 70M in 2015 to 120M where we are now.
We can see that in the last period after the merge, the supply has been almost stagnant, and even droped a little.
Ethereum Supply After the Merge
The chart for the new ETH issued after the merge and the transition to proof of stake looks like this.
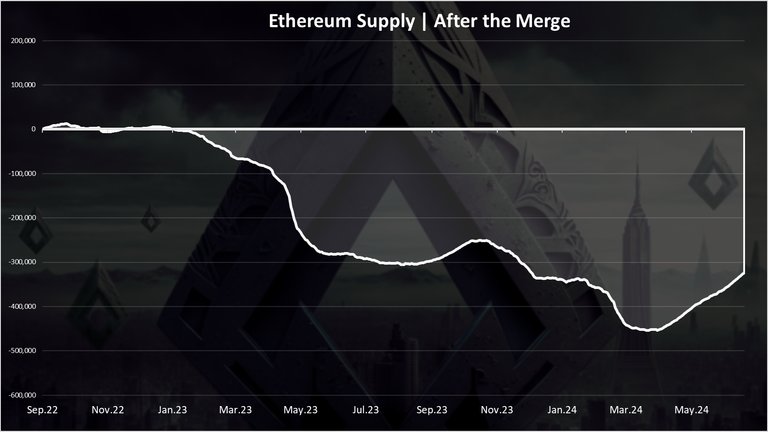
Overall, ETH has been deflationary in the period. But for how much? In absolute numbers it’s around -320k ETH, while in relative number it is -0.21%.
Since March 2024 we can notice that the ETH supply has been growing again due to less activity on the network and smaller amounts of fees burned. At the top there was more than 450k ETH burned since the merge, and now we are around 320k meaning a 200k more ETH was put in circulation in the last months.
The table for the yearly inflation looks like this.
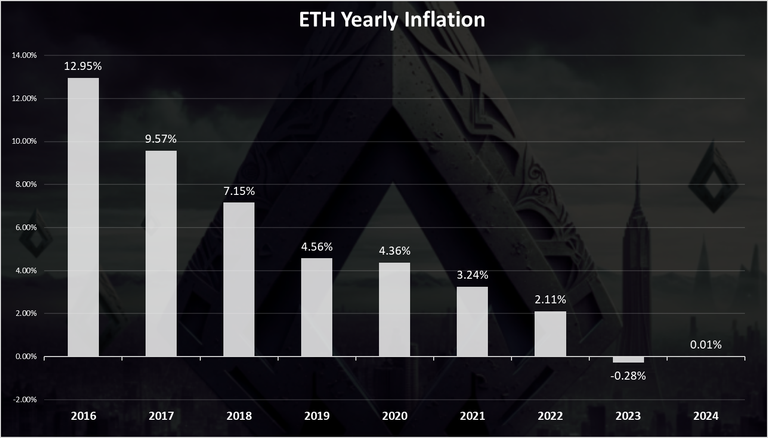
From more than 10% down to negative -0.28% in 2023. The last year was the first year in which Ethereum ended with deflationary supply.
2024 is almost neutral for now with just 0.01% inflation growth. But this is just for the first half of the year. Will see how it goes for the whole year.
Even the maximum inflation at 0.4%, Ethereum is now quite a hard asset.
Number of Wallets
Now for the general network numbers.
Here is the chart for the total number of Ethereum wallets created.
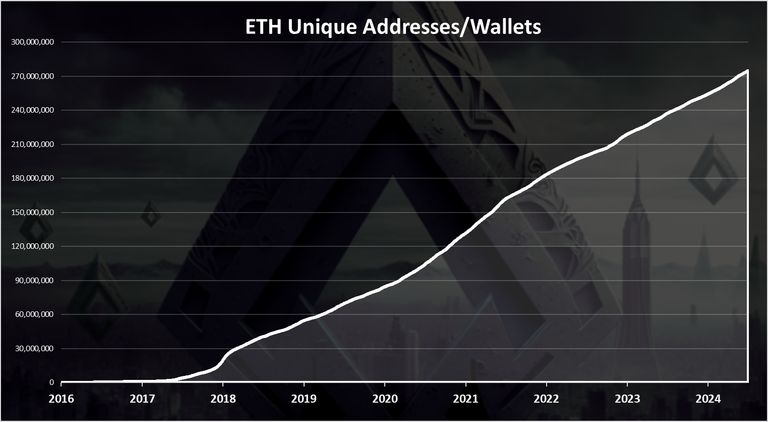
Ethereum now has more than 275M wallets! The numbers of wallets keeps growing at a steady pace.
When we look at the number of new daily wallets created we get this chart.

This is starting from 2022.
A steady number of new wallets created and then a spike after October 2022. From 70k up to 230k per day. After December 2022 the numbers went down again and up again in May 2023 to 200k. In the last period we have around 120k new wallets per day.
Active Wallets
How many of them are being used?
Here is the chart.
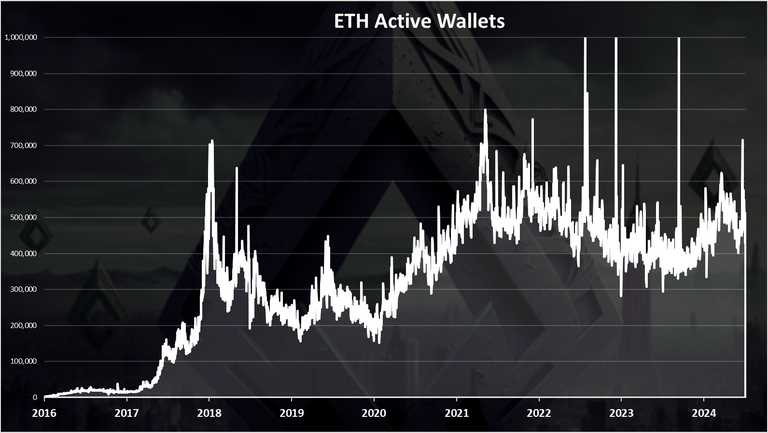
We can see that there was an overall uptrend up until 2021, reaching around 700k active wallets. Since then, there has been a downtrend up to December 2023, when it started growing again, from 400k to 600k active daily wallets.
Transactions
How about the number of transactions? Is the Ethereum network now more active after the merge? Here is the chart.
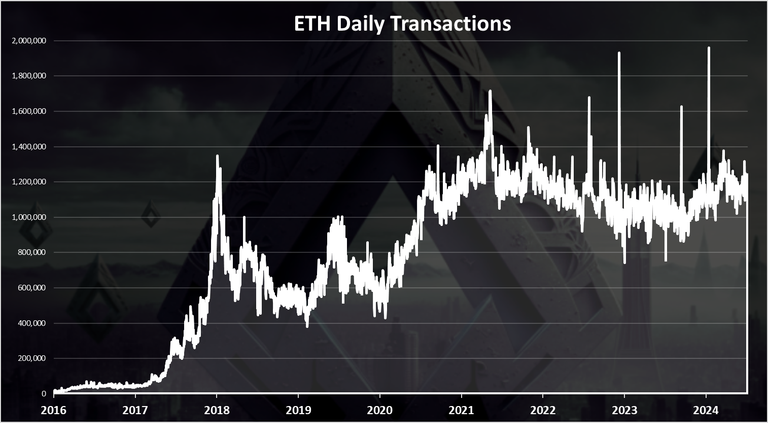
There was a spike in the transactions back in the bull market of 2017, up to 1.4M, then a drop to around 500k per day. In the previous bull market in 2021 the ATH was somewhere around 1.8M transactions per day, a steady drop since then and a growth again in December 2023, and we are now somewhere around 1.3M transactions per day on the Ethereum network.
Fees
There was misunderstandings that the merge will make the fees on Ethereum smaller. But this is not the case. The merge is a consensus upgrade, not a scalability upgrade.

At first there was a small increase in the fees back in 2017-2018 bull run. Then in the next bull ran a massive increase in the fees up to $100 at one point. A drop in 2022 and since then it has been in the range of 5 to 10 USD.
Staking Ethereum
Staking a big topic in the Ethereum network since the PoS upgrade. Here in short will just check the share of ETH staked from the overall supply. Here is the pie.
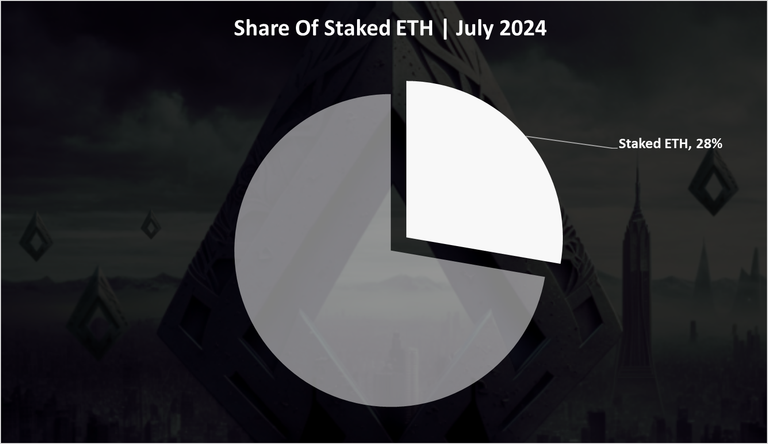
A 28% staked ETH from all the supply. The trend for the staked ETH has been constantly up in the last period. For a token of this size and market cap this is quite a big share.
Number of Contracts
Here is the chart for the number of smart contracts deployed daily.
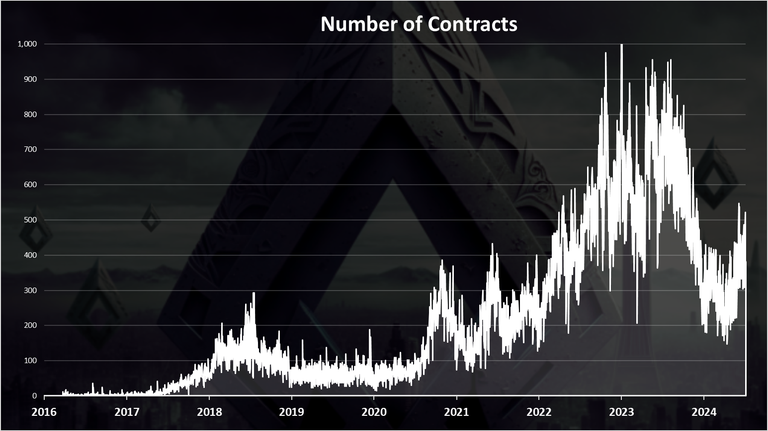
Interesting this number is up a lot in the last years compared to the previous period. A dip towards the end of the year. On average there are around 500 contracts now, while at the top this number was up to 900.
In summary the most noticeable change in the last period is that after a period of constant deflationary pressure on the supply, it has stabilized. The activity has increased toward the end of 2023 resulting in higher numbers for active wallets and transactions.
All the best
@dalz
Posted Using InLeo Alpha
ETH seem to be doing well
I’m shocked with the way there are so many new accounts
That’s massive!
The accounts on ETH are free.... so a lot are bot and farms, sort of spam...
Wow brother the reduced inflation rate for ETH is impressive. The growth in new wallets and transactions shows pretty strong network activity. I'm very excited to see future trends.
A lot of people seem to be transacting in ETH these days
It really makes sense though…
The inflation reduction for ETH is a good one and I hope it helps lift the price in the near future maybe when the bull run comes. From the look of things ETH is most likely going to outperform BTC in the bull market. Thanks for the interesting stats.
The change to POS continues to look like a good move for ETH. The accounts and activity seems to be going strong too. If they continue this trajectory, the price could skyrocket because of the increasing demand and decreasing supply.
This is really impressive, a lot of people are trading with ETH and more people are still coming on board. 👍
!ALIVE
ETH seems to be preparing to take the world massively