It's Sunday again, so let's jump into the world of technical analyses and see what these two tokens have been doing since last week.
We have 3 days left of this month, plus what's left of this day, so the monthly candle is not closed yet, but compared to last week or the previous two before that, this week the monthly candle looks a bit better and promising I'd say.
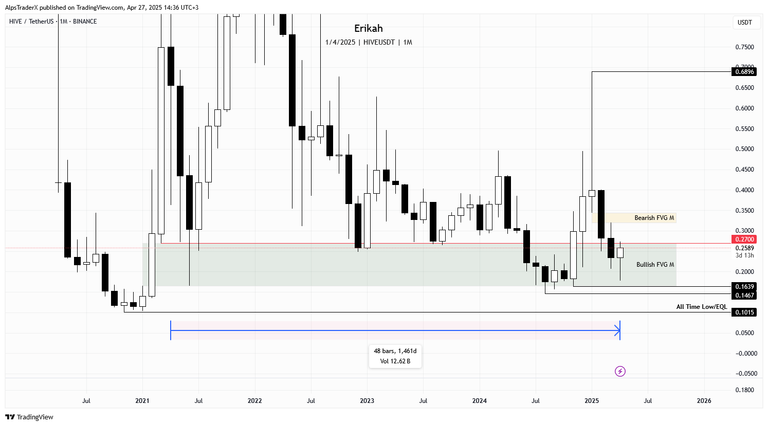
Looking back, it's amazing how this bullish gap has been holding price for 48 month, which means 1461 days. The candle closed in March 2021 confirmed the gap and since then, it's been retested by price 16 times. Finally this month looks like there's hope for price to close above it, but we can only know that in 3 days and for that to happen, price needs to close above $0.27 and hold. If that happens, the next resistance is the bearish gap, marked with yellow on my chart, which needs to be rebalanced and inverted for bullish continuation, after which the next target I'd be looking at is $0.6896.
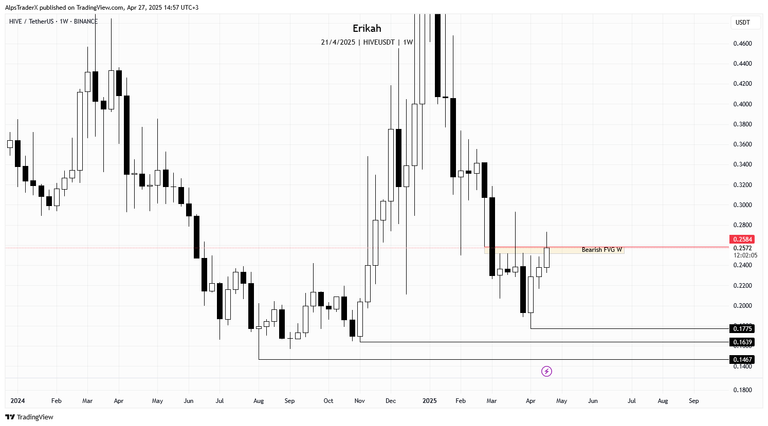
On the weekly time frame, price is at resistance, at a crucial level I'd say, trying to invert the bearish gap that has been capping the market for 6 weeks now. There are 12 hours till the candle close, and only then we'll know if price can close above the gap, or we register another rejection. There's no way to know, of course, but so far it seems price has the chance of closing above the last down close candle, which means an order block (OB) can be set. But again, we'll know only after the current candle closes.
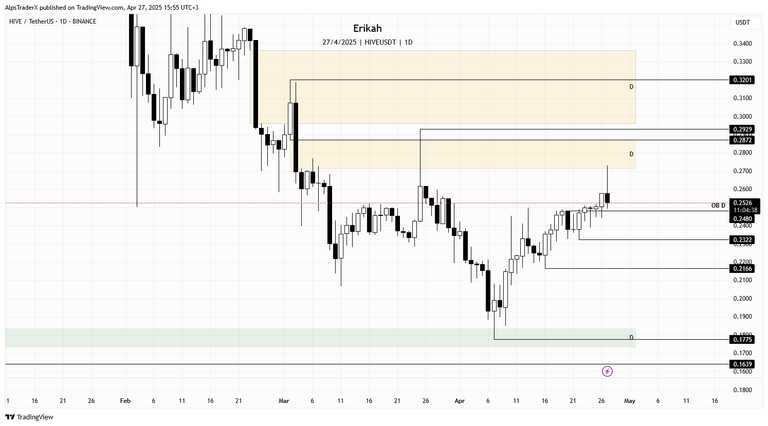
The daily chart looks clean. We have a bullish order block (OB) at $0.248, which has been retested three times and holding price nicely. Today price tapped into the bearish gap, marked with yellow on the chart, which is acting as resistance and capping the market for the moment. The current candle closes in 11 hours, so we have to wait to see the close, but unless price closes above $0.2872, we can expect rejection.
In case price starting to show weakness, the buy side of the curve (in plain English, the leg up from $0.1775) is very balanced, there's not much to stop price, all I see is juicy untapped liquidity, so I'd look for price to sweep $0.2322 and if we don't get a bounce from there, then the next level on the downside is at $0.2166.
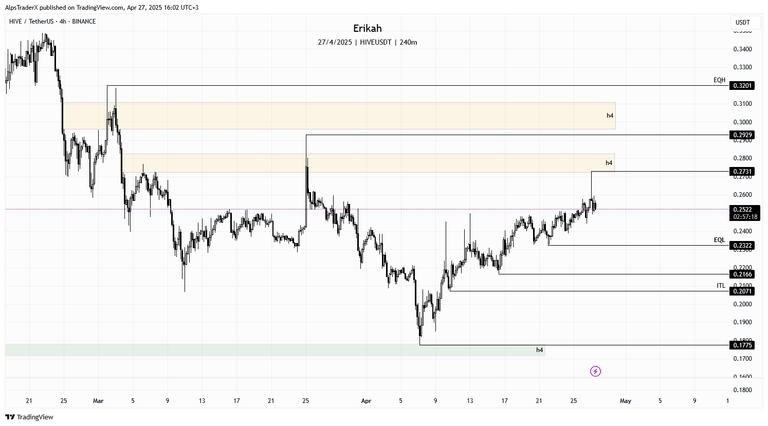
On the h4 time frame, price tapped into the bearish gap (yellow on my chart) and got rejected earlier today as there was not enough buying pressure to keep price at that level or better yet, to push higher. Based on the size of the wick of the candle, I suppose price is is going to seek liquidity lower.
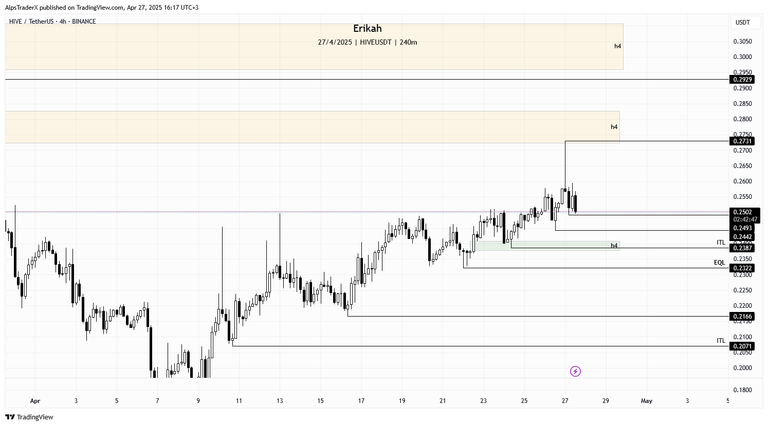
If I zoom in, these are the liquidity levels price could visit, in case there's no buying pressure, to push price higher.
In case we see strength, I'd expect price to sweep liquidity above the swing high, at $0.2731, then attempt to rebalance and invert the bearish gap above.
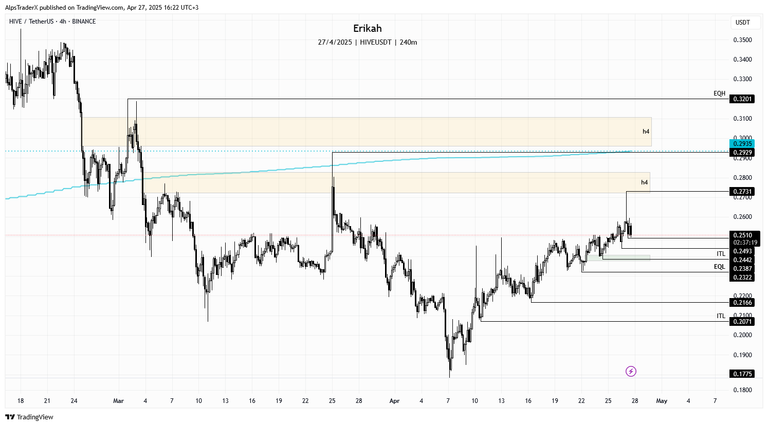
I'm not a huge fan of indicators to be honest, but it doesn't hurt to check some of the moving Averages (MA) from time to time and the 200MA, which is the 200 day moving average, is an important one.
At the time of writing, price is getting close to the 200MA, which at the moment is at $0.2935. Any asset under the 200MA is considered undervalued and $HIVE is in this situation. Let's see how much time it takes for price to climb above the 200MA.
Let's have a look at what $BTC has been doing lately.
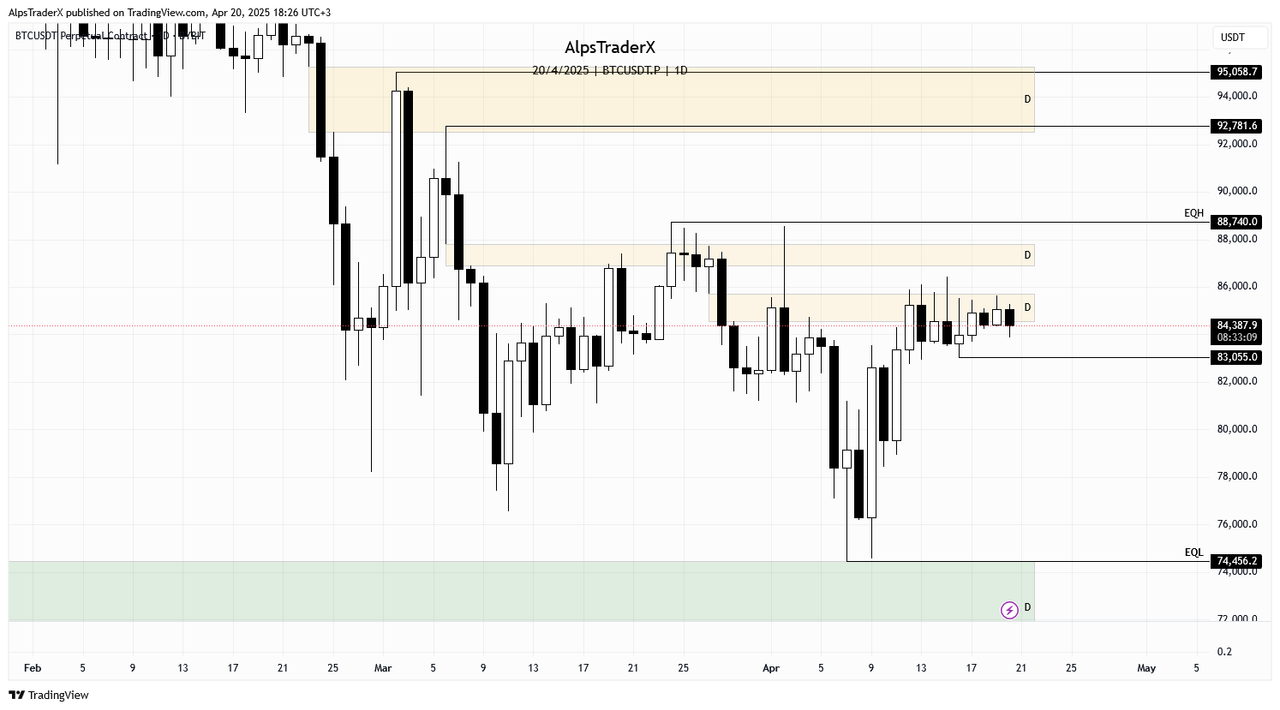
Last week price was still struggling to break above the bearish gap that has been capping the market for some time.
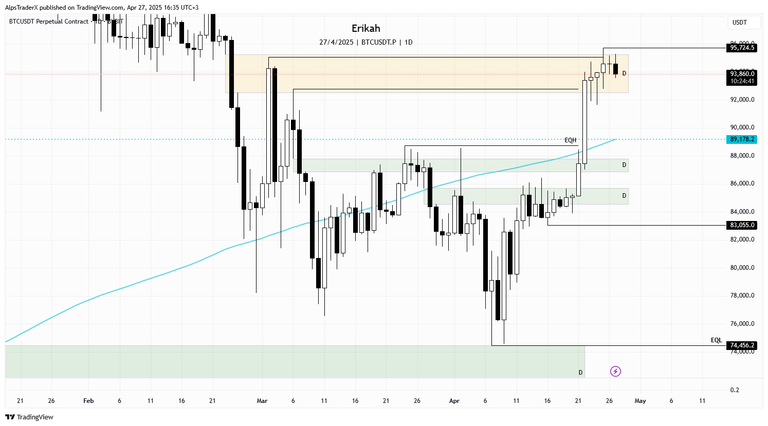
For demonstration purposes, I left the inverted gaps on the chart, but marked them with green, because they were inverted and now meant to hold price, which they do.
So on Monday this week, we had an expansion, which ended in price inverting and closing above the first gap, but got rejected by the second one. The next day, on Tuesday, we had an even bigger expansion, which resulted in price inverting the second gap and staying above it, but ran into the third gap. This gap is now fully rebelanced, internal liquidity was swept, but it is capping the market at the time of writing, because price has not manage to close above it yet.
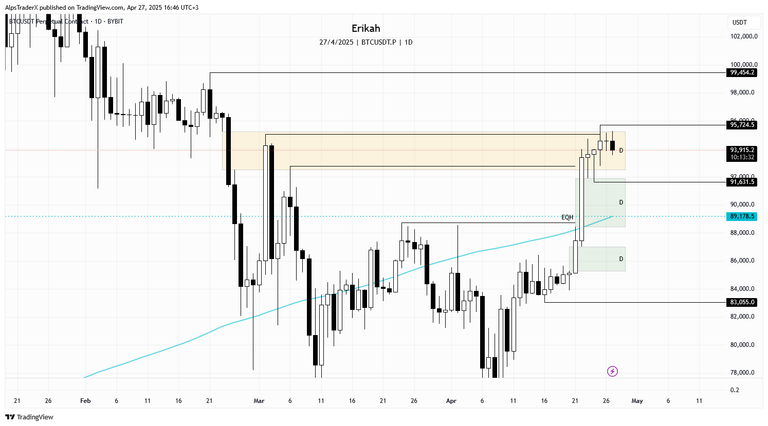
For bullish continuation, price must close above and hold $95,254, in which case the next liquidity pool is above the swing high at $99,454. In case price can't invert the bearish gap, I'd expect price to retest the bullish gap (green on my chart) sweep liquidity from the $91,631 level and maybe go lower. If the first bullish gap can't hold price, there's a chance to revisit the second one as well.
An interesting thing to note is, $BTC managed to reclaim the 200MA level this week, which is a bullish sign.
Now let's have a quick look at the economic calendar, to know what to expect next week.
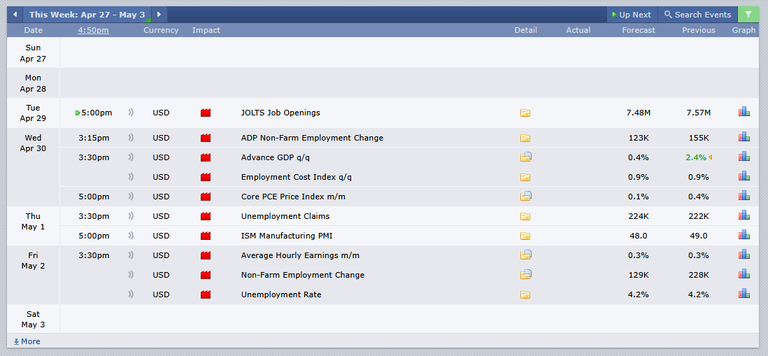
We have four red folder days next week, with some important and some (maybe) less important data. Looking at the forecast, there are some interesting changes forecasted, but we all know, sometimes they miss the forecast by a mile, so you can't bet your life on it, this is why it's better to be cautious, wait for the data candle to be printed and trade after.
Remember, technical analysis is not about forecasting price, but about reacting to what price does.
As always, this is a game of probabilities, not certainties. Also please note, this is not financial advice, it's my view and understanding of the market.
All charts posted here are screenshots from Tradinview.
Come trade with me on Bybit.

If you're a newbie, you may want to check out these guides:
- Communities Explained - Newbie Guide
- Cross Posting And Reposting Explained, Using PeakD
- Hive Is Not For Me
- How To Pump Your Reputation Fast - Newbie Guide
- Tips And Tricks & Useful Hive Tools For Newbies
- More Useful Tools On Hive - Newbie Guide
- Community List And Why It Is Important To Post In The Right Community
- Witnesses And Proposals Explained - Newbie Guide
- To Stake, Or Not To Stake - Newbie Guide
- Tags And Tagging - Newbie Guide
- Newbie Expectations And Reality
- About Dust Vote And Hive Reward Pool, by libertycrypto27

This is looking fairly positive and look forward to see where the candle closes and hope for a $0.27c or above. I like how you do these posts as you don't sugar coat and say it exactly as it is.
Thank you! There's no sugar coating here as charts don't lie and I have to say what the chart tells me.
Let's see what $HIVE does next, but tomorrow is Monday, so most likely we'll have some moves.
!discovery 30
!PIZZA
📈😀👍
Thank you my dear friend and have a nice evening :)
This post was shared and voted inside the discord by the curators team of discovery-it
Join our Community and follow our Curation Trail
Discovery-it is also a Witness, vote for us here
Delegate to us for passive income. Check our 80% fee-back Program
$PIZZA slices delivered:
@jlinaresp(13/15) tipped @erikah
Come get MOONed!
Congratulations @erikah! You have completed the following achievement on the Hive blockchain And have been rewarded with New badge(s)
Your next payout target is 128000 HP.
The unit is Hive Power equivalent because post and comment rewards can be split into HP and HBD
You can view your badges on your board and compare yourself to others in the Ranking
If you no longer want to receive notifications, reply to this comment with the word
STOPCheck out our last posts:
Nice milestone! Thanks Arcange 😉
That's great @erikah! We're excited to see your accomplishments on Hive! Keep going!
👍👍
Good advice 🙂