Happy Tuesday. The expected Upward Thrust (UT) in Phase C did appear, and it came with both the volume and PA one would expect for a bullish move up. The larger question is – does this mean the formation is bullish rather than distributive?
The 15M Intraday Chart
Looking at the 15M Intraday Chart, it appears as though the formation had a bullish breakout with Move 1 taking the PA to the $9,620.00 price handle, followed by a textbook formation of a Back-Up/Last Point of Supply (BU/LPSY) to the resistance line at the $9,560.00 price handle, and a subsequent surge from Move 2 to a Buying Climax (BC) at the $9,780.00 price handle.
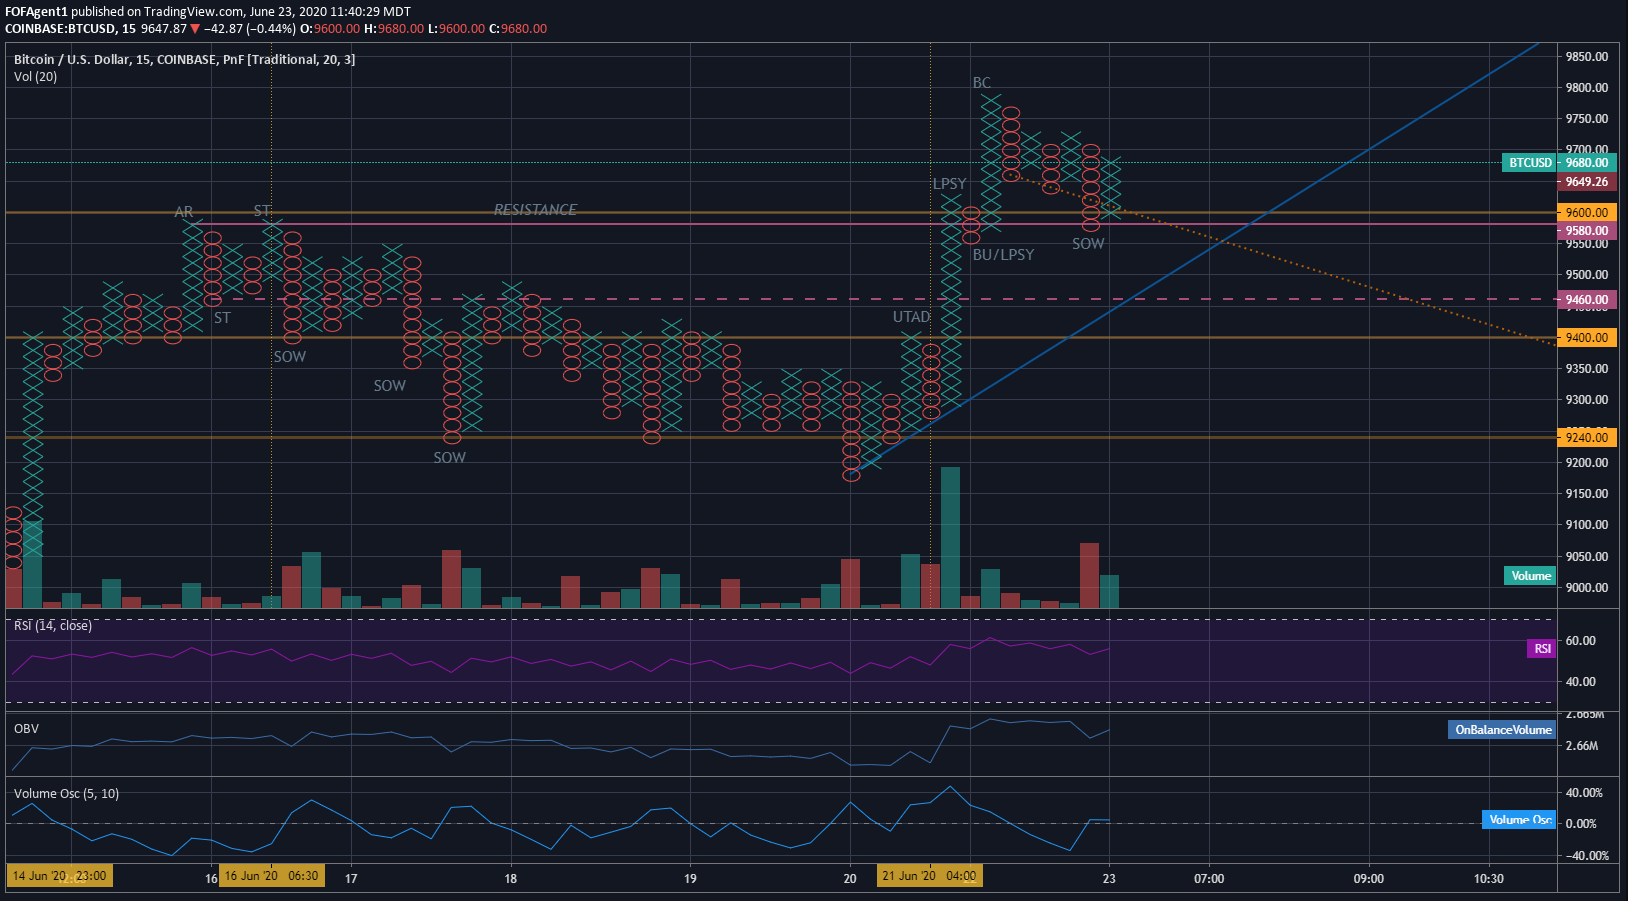
The recent move raised some red flags since the full cause built into the formation during consolidation was not exhausted. This would suggest supply is disproportionately higher than demand at this price point, and a turn lower in the PA should happen. The built-up cause should have ended with a Buying Climax at $10,420.00, but the PA has stopped well short of that price handle, which is a significant red flag. Moreover, since the Buying Climax at $9,780.00 on the 15M Intraday, the formation has not managed to break the $9,720.00 price handle on upward PA swings and has formed a Bearish Triple Bottom which did break the support line, bounced off resistance at $9,580.00 (potentially signaling support) and recovered to $9,680.00 price handle. Since recovering, it appears the formation is moving into a classic Phase A Wyckoff consolidation pattern on the 15M chart at the time of this writing.
The 4H Intraday Chart
Looking at the 4H Intraday Chart, the Upward Thrust After Distribution (UTAD) which took the PA from $9,280.00 to the $9,780.00 price handle, unambiguously signaled the formation has entered Phase C of a Wyckoff Distribution.
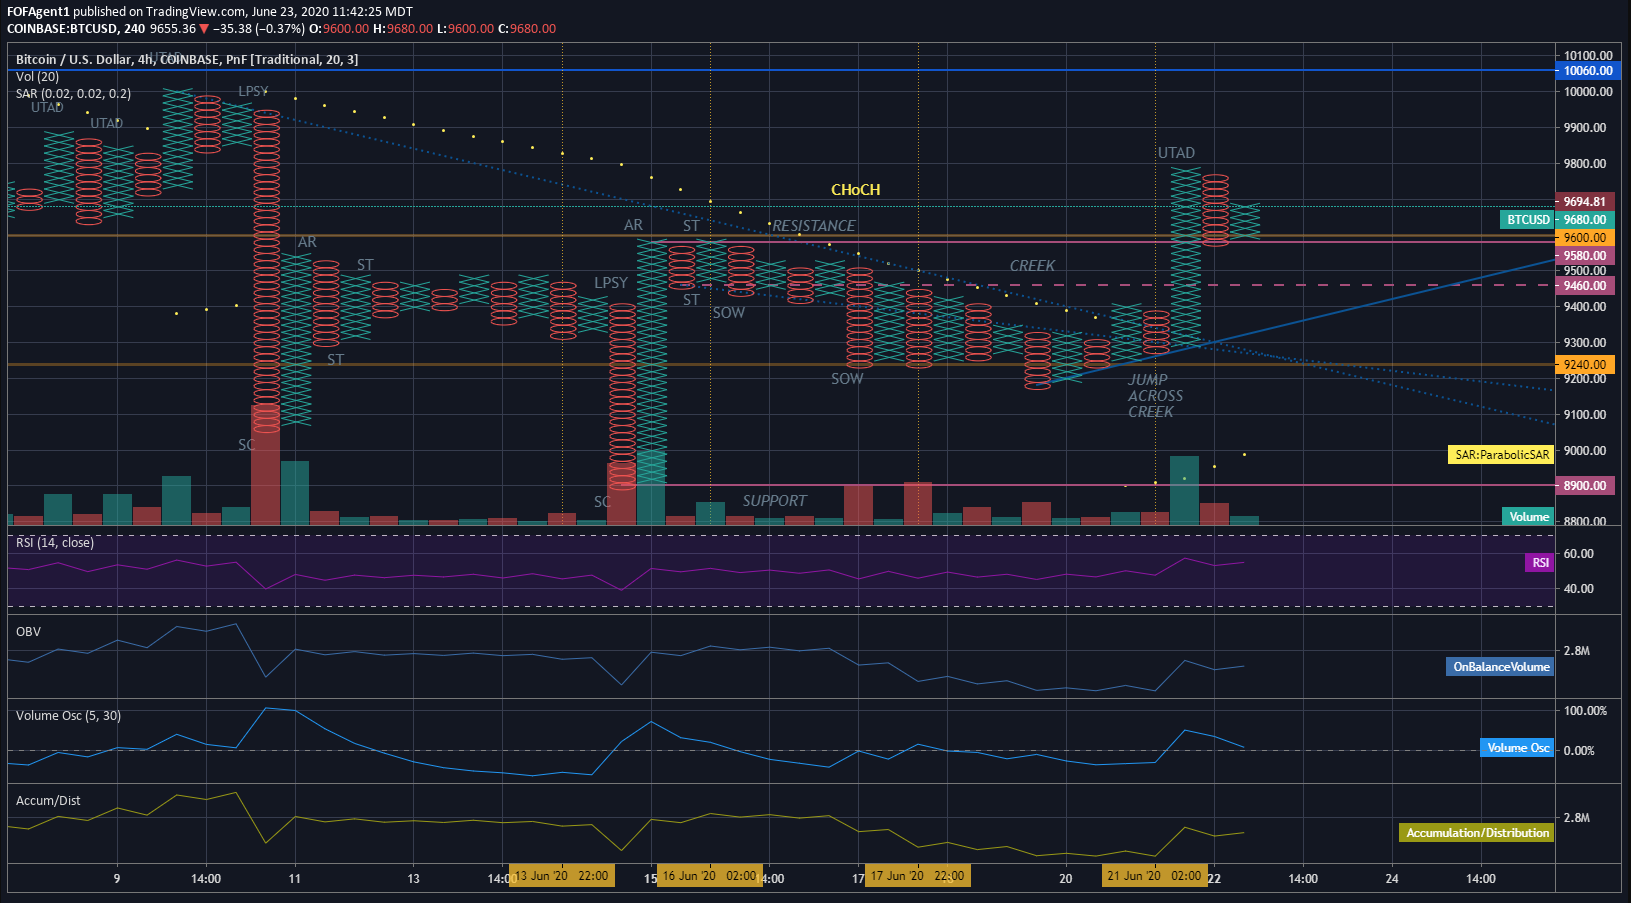
If the formation is, in fact, making a bullish move rather than a distributive bull trap, I would have expected two strong moves up to $10,420.00 on strong volume, which would bookend a Back Up to form a Last Point of Supply (BU/LPSY) right around resistance at $9,580.00 (Move 1 -> BU/LPSY -> Move 2). The formation had a strong Move 1 on solid volume (11.748K) to $9,780.00 and performed a textbook Backup/Last Point of Supply (BU/LPSY) exactly to the resistance line at $9,580.00. However since that time, the formation has failed to generate any real volume in over 8 hours (1.397k) or surge past $9,780.00 to exhaust the remaining cause at or near the Target Price of $10,420.00. This is beginning to look more like a very well executed bull trap. Also, there may be some fundamental evidence to support this narrative.
On the fundamental side, Onchain Analyst Cole Garner posted an infographic on his Twitter account about the recent spike in BTC miner outflows overnight.
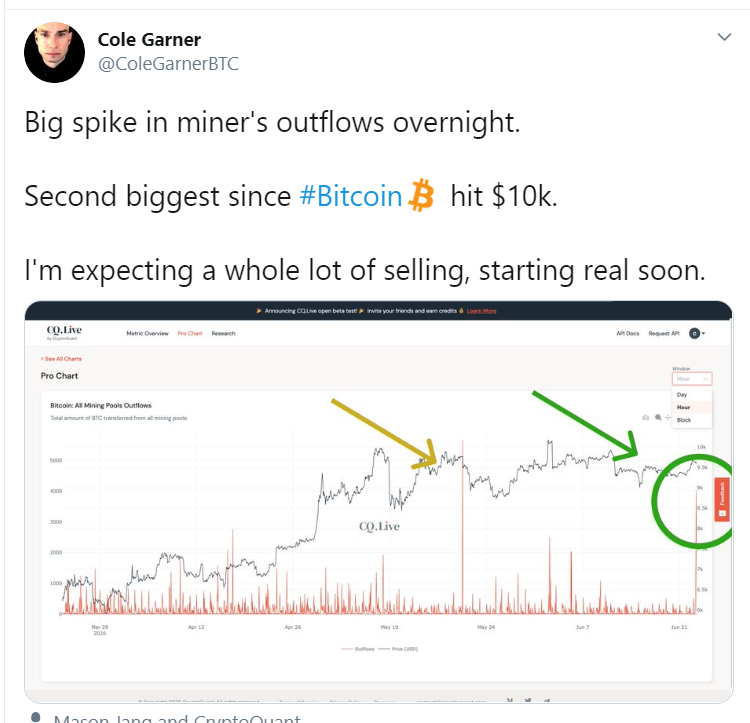
If this is true, it would suggest miners which were initially hoarding BTC waiting for PA to move higher post halving have hit capitulation and are unable to continue holding their BTC in anticipation of a higher price. This also may explain Preliminary Supply (PSY) flooding the market at the $9,720.00 handle, which halted the PA rise.
The 1D Chart
On 1D chart, after forming a “Creek” of descending PA and increased volume, the Upward Thrust After Distribution (UTAD) signaled a move into Phase C of a Wyckoff Distribution (again arguably the most volatile of the Wyckoff Phases).
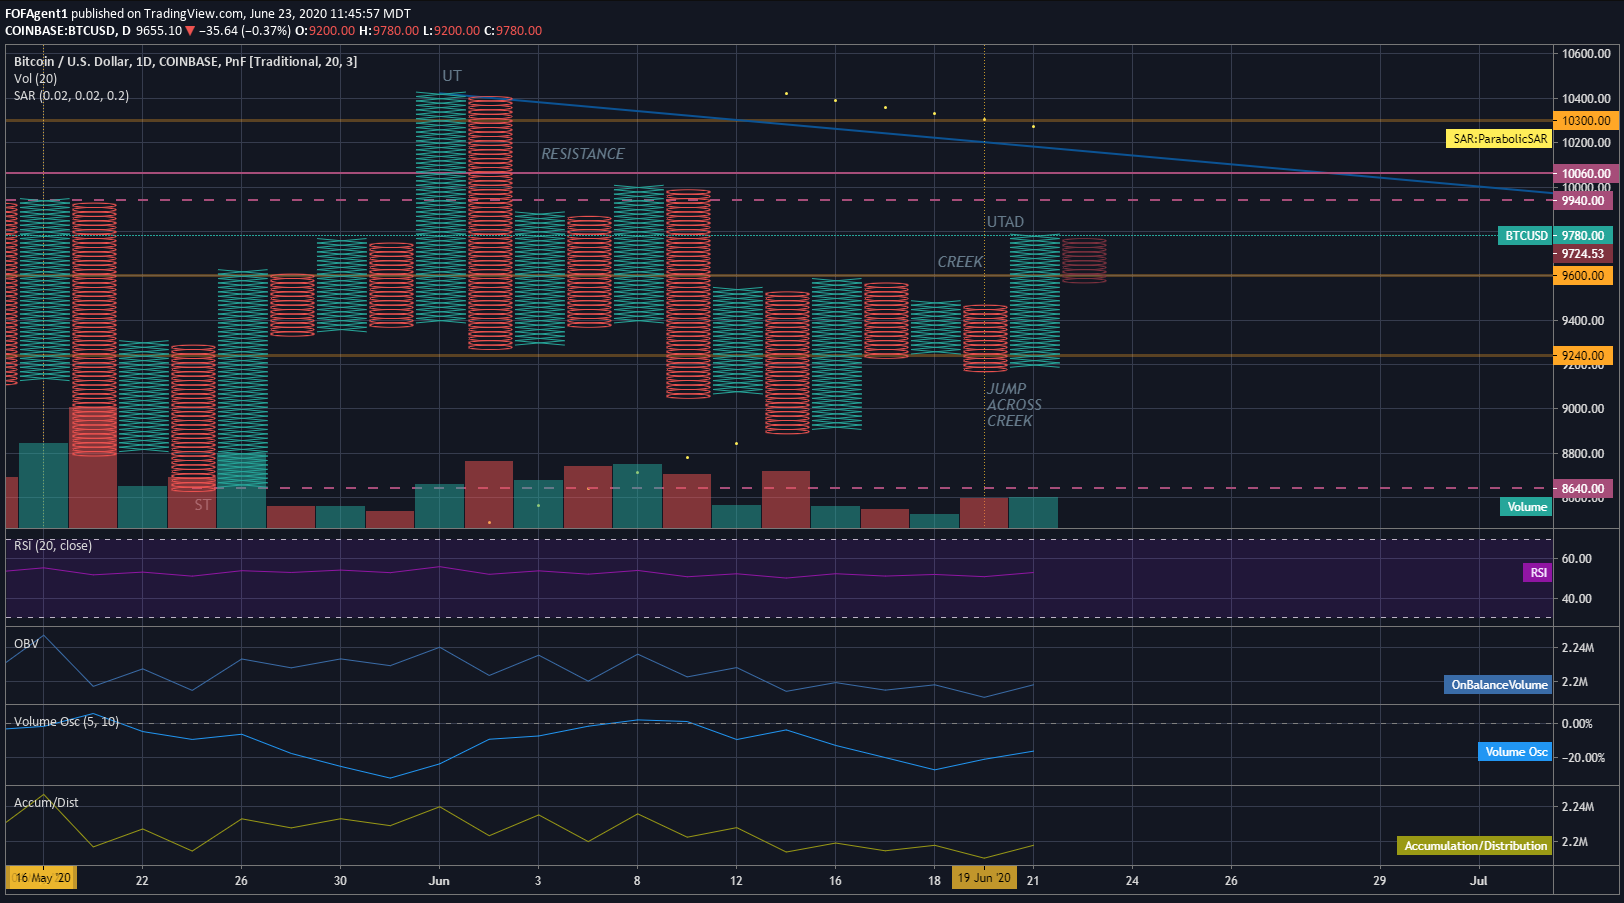
Something of note - the Upward Thrust After Distribution (UTAD) which formed at the Jump Across the Creek, failed to rise to at least the lower line of resistance at the $9,940.00 price handle. This would suggest supply has entered the market which is disproportionately greater than demand at this price range, and lower PA should be on the table soon. However, since the formation is in Phase C, Upward Thrusts After Distribution (UTAD) are normal and should be expected. It is possible we could see a move higher to $10,420.00 if the full cause is exhausted on this current move before a move back down into the normal trade range.
Summary/Trade Plan
In my mind, the recent PA feels more like a bull trap rather than a bullish move up and the Risk/Reward appears to favor a move down.
The trade plan is to enter a short position Somewhere in the $9,680.00 - $9,650.00 region with a Stoploss at the $9,730.00 price handle. The Target Price for the short position would be $8,820.00. Should the Stoploss trigger, and a move higher ensue, I would take a long position at the $9,765.00 price handle with a Target Price of $10,420.00 on the move higher.
Always remember this is not trading advice.
Outside of that, Happy Trading.
You can follow me and keep up to date on Tradingview as well. I trade under the handle FOFAgent1 at tradingview.com
Posted Using LeoFinance