.png)
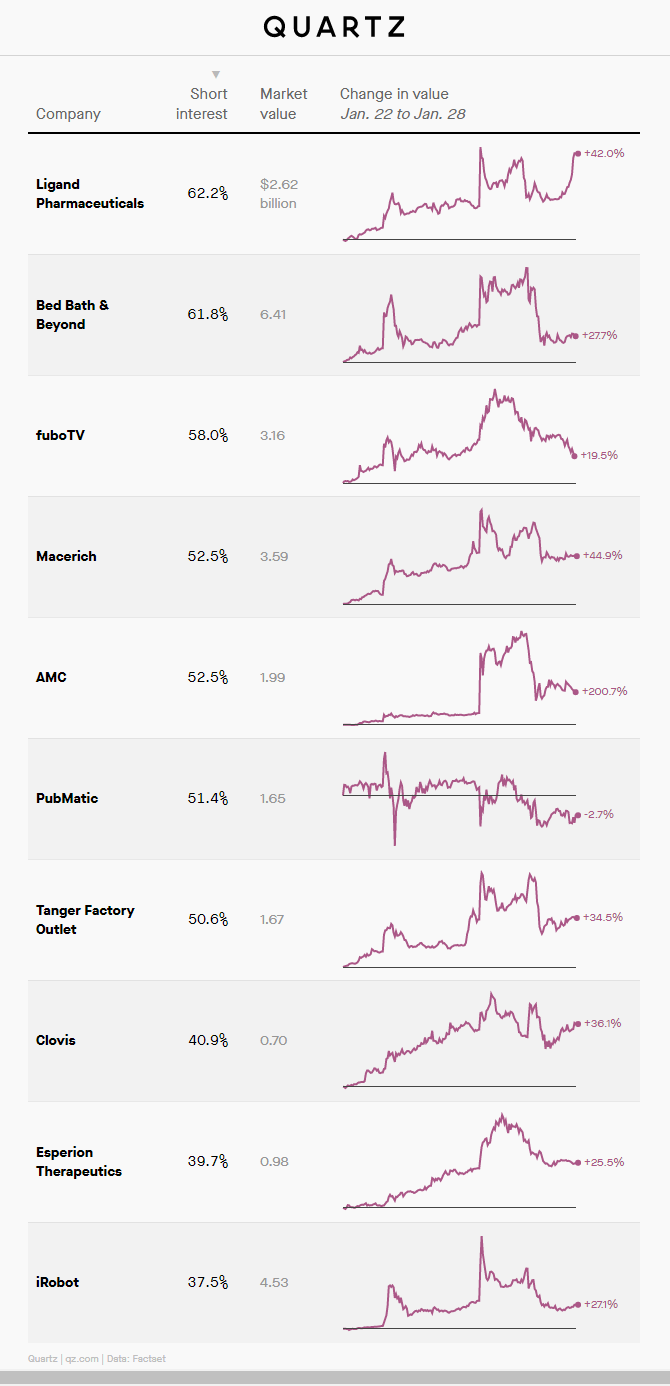
These are the 10 most shorted stocks outside of GameStop and I am not showing these charts to encourage anybody to go try and initiate a short squeeze. The chart actually shows some evidence that you could be late to the game if you were trying to initiate a short squeeze.
These charts are from an article in Quartz. I am not here to read the news and repeat the story so if you want to read the story go here:
https://qz.com/1965817/beyond-gamestop-these-are-the-10-most-shorted-stocks/?utm_source=YPL
Analysis
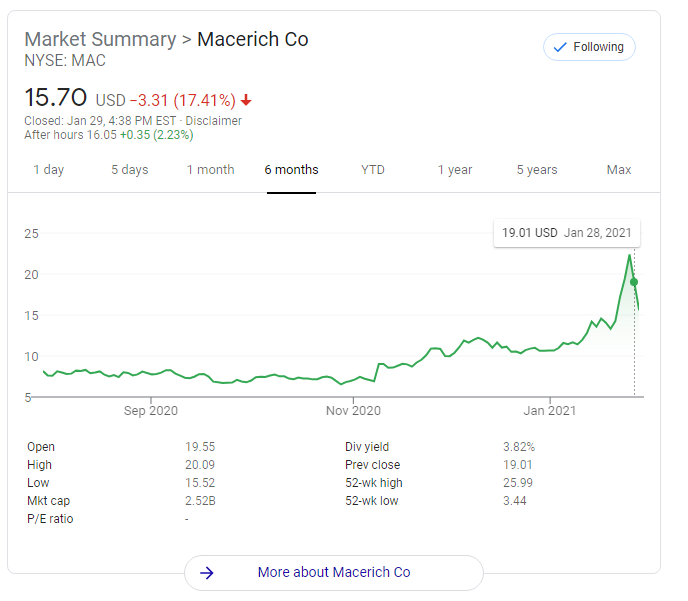
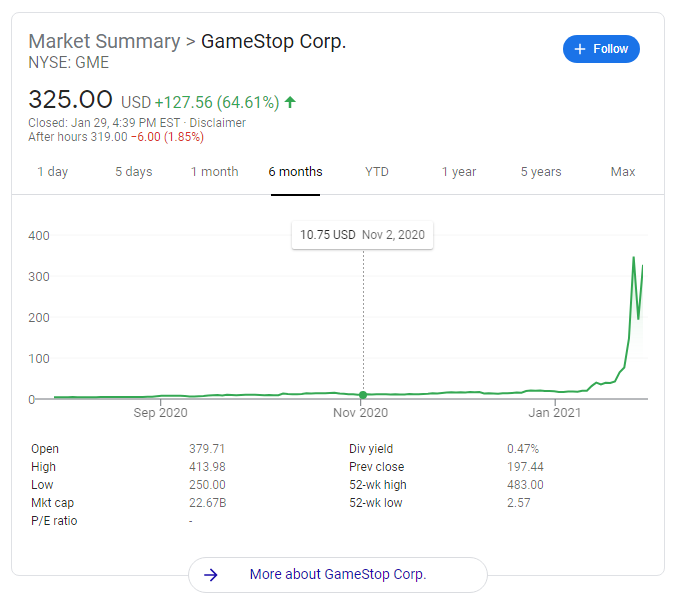
These charts are for a period of about a week, but if you were too look at a longer time horizon for short squeezes what you would see is a long period of flat followed by a spike. When you look at the one week window there are a lot of spikes, but when you zoom out to 6-months you get a different resolution.
Below is the chart for MAC which owns and rents shopping malls and GameStop which most of you are familiar with:

MAC Chart from Google Finance ^

GameStop Chart from Google Finance ^
The way to identify the start of a short squeeze is to break it into 3 parts--The early, mid, and late part:
Early - You initiate a short squeeze with rapid buying. This drives demand which increases the price.
Mid - Investors who have open short positions are now in a position where they could lose money on their short positions because the price is going up instead of down. These investors panic and start buying in order to over their shorts. This panic buying causes the price to increase which encourages other people who are short to panic even more. This cycle reinforces and you see exponential explosion in price.
Late - After short investors are finished buying / covering the short and the price has skyrocketed a few things can happen:
a) The high price makes the stock attractive for shorting again and the sales by short investors creates pressure for downward prices. The re-shorting can lead to more cycles of short squeezing.
b) After the short squeeze and all of the short interest have been covered the stock is left at a high price that is overvalued and there are no short interest left to cover so there are no buyers left for these over priced stocks and the price starts to fall because of low demand.
c) The stock price gets high, but the company is more sound than the short sellers realize and the stock continues toward recovery and growth.
Now that we know the components we can use that to try to interpret some of first charts that I posted.
Ligand Pharmaceuticals, Bed Bath & Beyond, Macerich, Tanger Factory Outlet, Clovis, and iRobot appear like multiple distinct spikes and suggest multiple rounds of short squeezing. This would be what I described in Example A.
fuboTV, AMC, and Esperion look more like a single large spike which is consistent with Example B so far.
Tesla would be a good example of a company that went through a long drawn out period with multiple short squeezes, but they recovered and started to grow. This would be Example C.
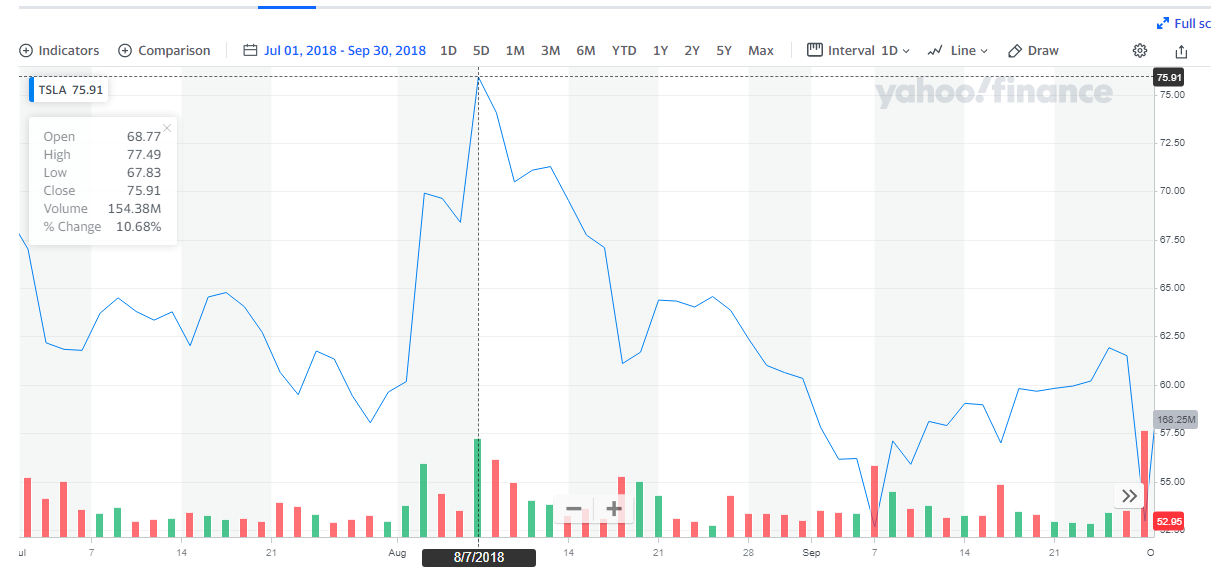
One of the most known periods of short squeezing was the period where he Tweeted that he would take TSLA private at $420 a share. Keep in mind that the share price was in then $60 range when he did this.

Below is the chart from Yahoo Finance that covers TSLA a month before the Tweet and a month after:

Note the local maximum or high price for that window occurred on the day of the Tweet. In this case he used a Tweet instead of Reddit to initiate the short squeeze. The SEC fined him 20 Mil, suspended him from serving as chairman of the board for 3 years, and required him to have legal counsel prescreen his Tweets.
We all know the rest of the rest of the story and this is the most notable story for Example C where a company goes through a short squeeze or multiple short squeezes and goes on to prove the haters wrong and becomes a success story.
These charts are quantitative data that tell part of the story. You should also do qualitative research when making your assessments. In using the charts to describe what is happening I intentionally use the phrase that the chart "suggest".
There are a lot more deeper insights that can be drawn from the charts, but I what covered were the basics.
Posted Using LeoFinance Beta
https://www.marketwatch.com/story/here-are-the-biggest-short-squeezes-in-the-stock-market-including-gamestop-and-amc-11611842270?mod=home-page
Congratulations @therecantonlybe1! You have completed the following achievement on the Hive blockchain and have been rewarded with new badge(s) :
You can view your badges on your board and compare yourself to others in the Ranking
If you no longer want to receive notifications, reply to this comment with the word
STOPCheck out the last post from @hivebuzz: