Good day Hiveians!
Join me in analyzing the crypto markets!
Hive's fractal is completed and is ready for a push upwards
3 weeks ago, just after the big push to $1 I gave an outlook of what to expect for the coming weeks. Let's have another looks since this worked exceptionally well; it also "proves" that understanding the movement of a coin means to be able to give fairly accurate predictions.
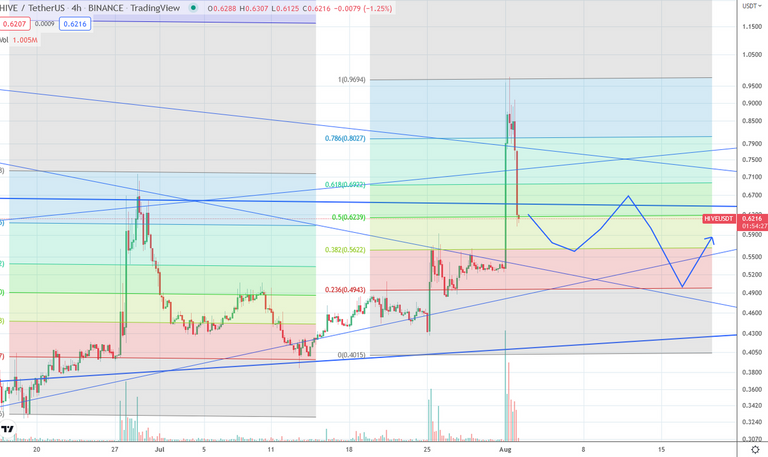
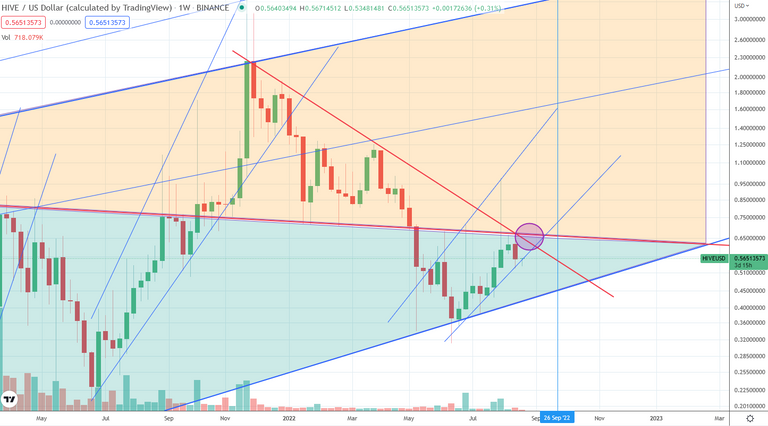
Here is the actual price development:
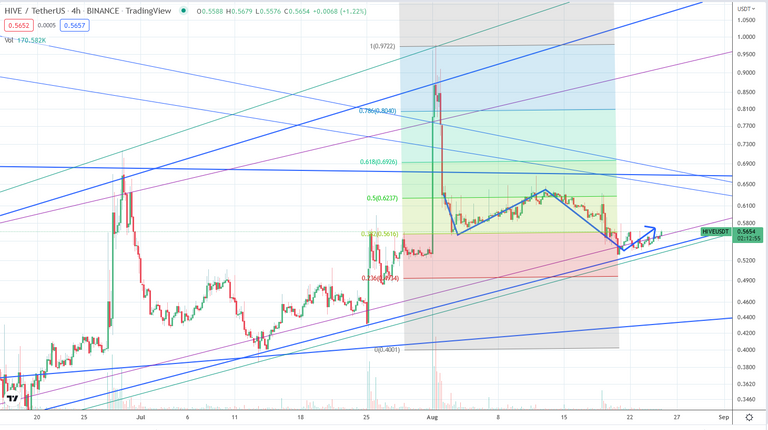
I would call this a really good prediction: it exactly (!) predicted the first stop at 55 cents, then it went up to about 67 cents and the final correction to 52 cents (I predicted 50 cents). Not only were the price targets met, but the time frame was also very close to what we saw. I have to add, that we could have easily seen a different movement in terms of price actions and time while it would have still been the same shape. So I got lucky here ;)
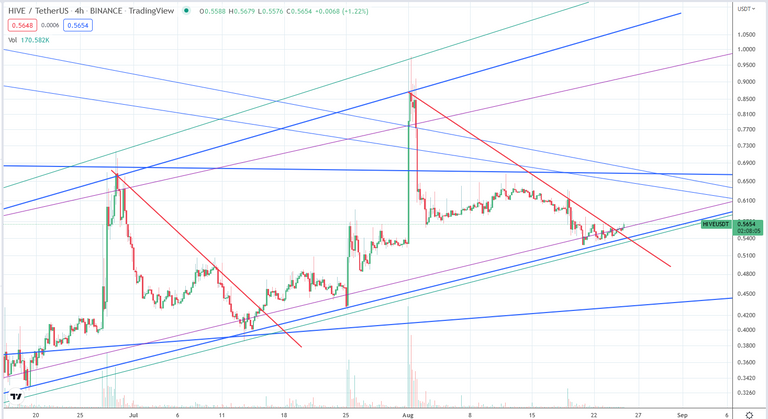
Fractal completed, next stop at?
Hive is now ready for the next jump. At least from a TA perspective everything is fulfilled: (a) the fractal is completed; (b) price is holding at the supporting trend lines (they have different colors according to the scale); (c) price has broken out of the red trend line from previous highs. We could be just days away from the next big push.
I can see price moving higher either very soon (days) or a smaller push towards the resistances and another pull back with another retest (weeks):
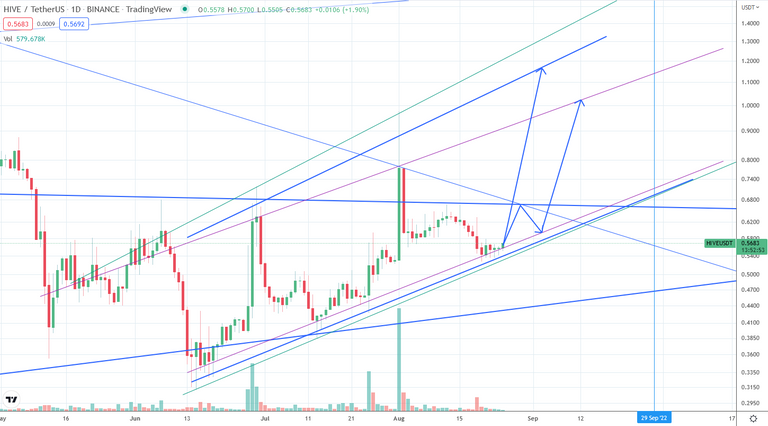
So what is keeping price down (for now)? On the bigger scale we can see that there are two major resistances which, however, have already been broken of the daily chart in the previous pump. In the weekly chart they become clearer:
We see the resistances as the trend line from previous highs (diagonal red line) as well as the horizontal divide from previous price movements (horizontal red line). They have a resistance between 63-66 cents. If price can breach this area it will probably push to about $1.2 and stay above these resistances. In the future I would expect another retest of this area, however. The weekly chart could look something like this:
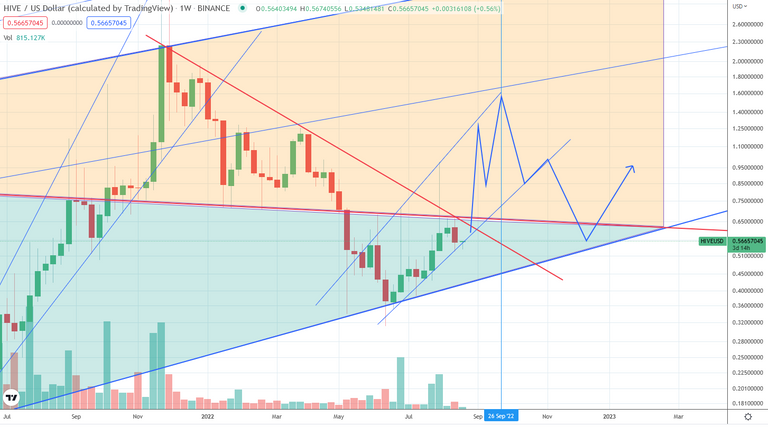
In other words, very volatile movement to about $1.6 and then probably a larger correction back to about 50-60 cents depending on the macro crypto market in general. So it might be a good idea to keep some Hive liquid!
As a general reminder: Please keep in mind that none of this is official investment advice! Crypto trading entails a great deal of risk; never spend money that you can't afford to lose!


Check out the Love The Clouds Community if you share the love for clouds!
Nice one and I hope this analysis help in getting the accurate time too
thanks! Hard to exactly predict it, but I think there's a good chance for a bigger jump in the next days/week
Have been using your analysis to buy hive and so other coin
Posted Using LeoFinance Beta
glad if it is helpful to you, just don't forget that I get things wrong as well ;)
@tipu curate
Upvoted 👌 (Mana: 15/45) Liquid rewards.
The analysis is well written and understood, the hive price would soon make more push, it does since the day I started to follow your analysis, thank you for sharing this with us.