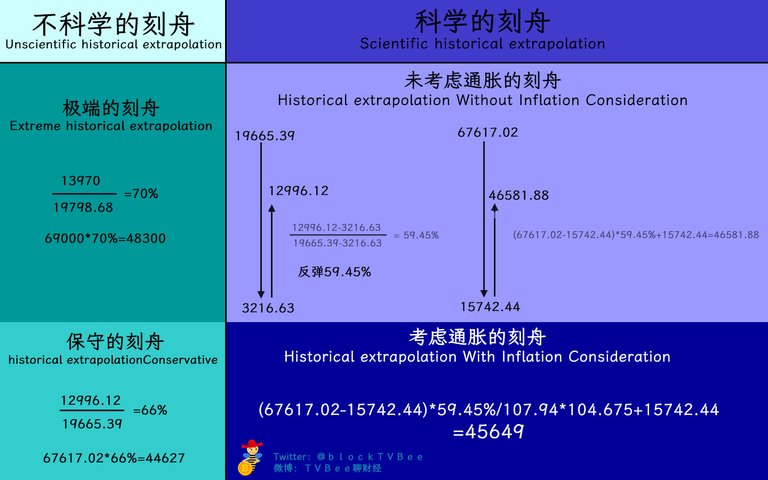
➤ Extreme historical extrapolation
Some calculated from 2017 to 2019, with a high of 19798.68 in 2017 and 13970 in 2019.
Rebound Ratio = 13970 / 19798.68 = 70%
2023 High Based on Extreme Historical Extrapolation = 69000 * 70% = 48300
Firstly, using the highest point of the candlestick's upper shadow for calculation is too extreme, as there is little volume at that position.
Secondly, Bitcoin's lowest point in 2013 was in the double digits, which can be ignored. But the lowest in 2018 being over 3000, and 2022 being over 15000, can't be ignored. For pullbacks and rebounds, the difference should be calculated. For instance, if Bitcoin rises from 400,000 to 500,000 in the future, should you calculate its pullback based on 500,000? It should be based on the difference (50-40)!
According to CoinGecko data (which is volume-weighted average value and better reflects the inflow and outflow of funds):
2017 peak: 19665.39
2018 bottom: 3216.63
2019 peak: 12996.12
2021 peak: 67617.02
2022 bottom: 15742.44
➤ Conservative Historical Extrapolation
Rebound Ratio = 12996.12 / 19665.39 = 66%
2023 High Based on Conservative Historical Extrapolation = 67617.02 * 66% = 44627
The current high has reached 44700, which is the market situation for now. (That's why I say the data in the crypto world is concerning)
➤ Scientific Extrapolation (Excluding Inflation)
Rebound Ratio = (12996.12 - 3216.63) / (19665.39 - 3216.63) = 59.45%
2023 High Based on Scientific Extrapolation (Excluding Inflation)
= (67617.02 - 15742.44) * 59.45% + 15742.44 = 46581.88
➤Scientific Extrapolation (Including Inflation)
However, there's an important issue: the macro environment now is very different from back then. From 2018 to 2019, interest rates and inflation were relatively stable.
Currently, it's not like that. From November 2021 to November 2022, the inflation rate was between 6.8% and 9.1%, with an average inflation rate of 7.94%.
From November 2022 to November 2023, the inflation rate was between 7.1 and 3.1, with an average inflation rate of 4.675%.
This means that the purchasing power of $107.94 during the decline and $104.675 during the rebound is the same. Let's adjust with this:
2023 High Based on Scientific Extrapolation (Including Inflation)
= (67617.02 - 15742.44) 59.45% / 107.94 104.675 + 15742.44
= 45649
➤Conclusion
Regardless of whether the historical extrapolation analysis is correct, a target of 48000 seems exaggerated (of course, if the BTC spot ETF is approved, 48000 is possible, or even higher, but that's beyond historical extrapolation. Moreover, the current market top, as indicated by historical extrapolation at over 44000, is also not scientific.
But the scientific historical extrapolation is only about 45000-46000. Of course, the influence of ETF sentiment is also beyond historical extrapolation.
Overall, from the historical extrapolation results:
In 2023, BTC has mostly completed or is about to complete the market trend of the first half of 2019 within a year.
We cannot rule out the possibility and potential for BTC to rise further, but the probability and risk of rising must be faced.
Altcoins (especially those not correlated with BTC) need to be approached more cautiously going forward.
我发现币圈人的数学有些堪忧,连刻舟都不会——刻舟这一波小牛的BTC高点是多少
➤极端的刻舟
有人计算从2017到2019,2017高点19798.68,2019高点13970
反弹幅度=13970/19798.68=70%
2023年极端的刻舟高点=69000*70%=48300
首先,用K线上影线上的最高点计算,过于极端了,在那个位置是没有什么量的。
其次,大饼2013年最低的时候2位数,就可以忽略了。2018年最低3000多、2022年最低15000,那就不能忽略了。那回调、反弹,那得计算差值啊。假如BTC将来某一轮从40万涨到50万,你能以50万为基础计算它回调吗?那应该是以(50-40)为基础计算回调啊!
按coingekco数据(coingekco的数据是按交易量加权平均的价值,可以更好的反应资金的流入和流出情况)
2017年顶部:19665.39
2018年底部:3216.63
2019年顶部:12996.12
2021年顶部:67617.02
2022年底部:15742.44
➤保守的刻舟
反弹幅度=12996.12/19665.39=66%
2023年保守的刻舟高点=67617.02*66%=44627
目前高点达到44700,市场现在暂时就是这种情况。(所以我说币圈人的数据堪忧)
➤正确的刻舟(不考虑通胀)
反弹幅度=(12996.12-3216.63)/(19665.39-3216.63)=59.45%
2023年的理论刻舟高点(不考虑通胀)
=(67617.02-15742.44)*59.45%+15742.44=46581.88
➤科学的刻舟(不考虑通胀)
但是,还有一个重要的问题,现在的宏观环境和当年差很多,从2018到2019年,利率和通胀情况相对是比较稳定的。
现在可不是这样,2021年11月到2022年11月通胀率在6.8%~9.1%之间,平均通胀率7.94%
而2022年11月到2023年11月的通胀率在7.1~3.1之间,平均通胀率4.675%
也就是说下跌过程中的107.94美元和反弹过程中104.675美元的购买力相同。用这个再修正一下
2023年的理论刻舟高点(考虑通胀)
=(67617.02-15742.44)59.45%/107.94104.675+15742.44
=45649
➤刻舟以外
咱先不管刻舟对不对,但刻舟48000属实夸张了(当然,如果BTC现货ETF通过,那48000是有可能的、甚至可能更高,但这是超出刻舟以外的)。另外,现在市场的顶部表现出的,刻舟44000多其实也不科学。
但科学的刻舟,也不过就是45000-46000多。当然,ETF的情绪影响也是刻舟以外的。
总体上,从刻舟的结果来看:
一、BTC在2023年用1年的时间大体上走完了、或者即将走完2019年上半年的行情。
二、我们不能排除BTC还有向上的空间和可能,但是向上的概率和风险是必须要面对的。
三、山寨币(尤其是那些和BTC不相关的山寨),接下来需要更加谨慎的面对。
My twitter: https://twitter.com/blockTVBee/