Hello again. I don't remember the last time I shared an ETH chart. This may be because I don't invest or trade Ethereum. However, we need to regularly follow the blockchain status of cryptocurrencies such as ETH, SOL, etc. and the price charts of these cryptocurrencies. If there is going to be a bull season in the altcoin market, we will first see the signs of this in cryptocurrencies such as ETH, SOL, AVAX, etc. For this reason, I decided to share with you the ETH/USDT chart that I have started to follow. Chart data is from Tradingview. And price action data is from Binance Exchange.

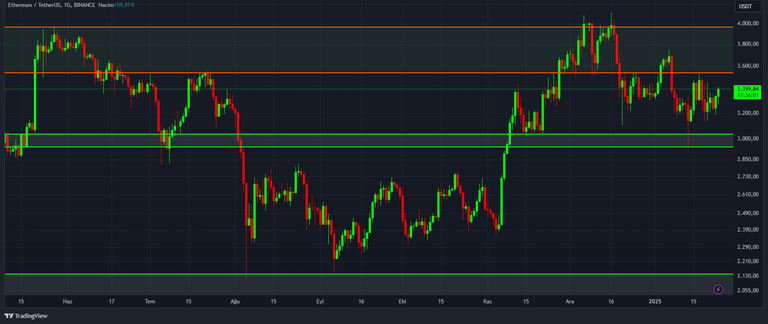
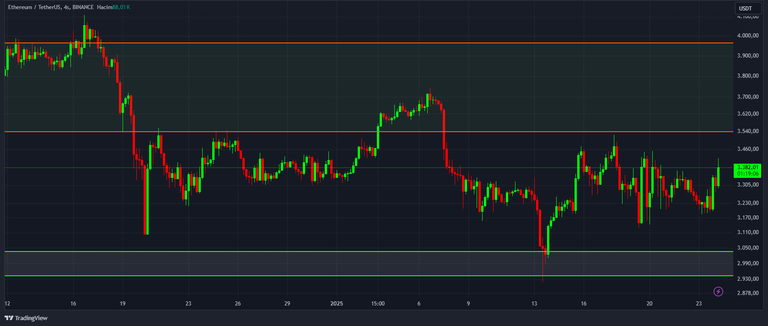
The chart I shared the screenshot above is in the daily time frame. The supply-demand zone below is in the 3036-2940 price range. There is a wide supply-demand zone above. Ethereum price has been stalled in this zone for a long time. The supply-demand zone in question is passing through the 3530-3960 price range. I will add another screenshot below for those who follow the price in shorter time frames.

I am not an investment consultant. You should make investment and trading decisions according to your own financial and psychological state. It would be more useful to see such analysis sharing as an educational study. See you again. Stay tuned.
Posted Using INLEO
Imagine will go over 4.000$ until the end of the month
!PIZZA
$PIZZA slices delivered:
@panosdada.pob(3/5) tipped @anadolu