The year 2024 is long over, but like all the last year's I have made a post of the interesting data I have collected during the year and see what were the extremes and when, which was the warmest or windiest month, and so on. So let's dive on in and see.
Temperature
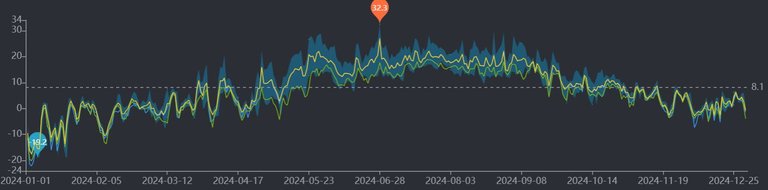
Warmest day: 28th June, 32.3C(90.14F)
Coldest Day: 6th January, -19.2C(-2.56F)
Crazy difference between seasons, right?
Warmest month: July, avg temp 18.9C(66F)
Coldest month: January, avg temp -6.1C(21F)
Avg temp of 2024, 8.1C(46.1F)
Keep in mind that this data is specific to where I live near the sea. These numbers vary in other parts of Estonia.
Here is a yearly temperature graph.
Rainfall
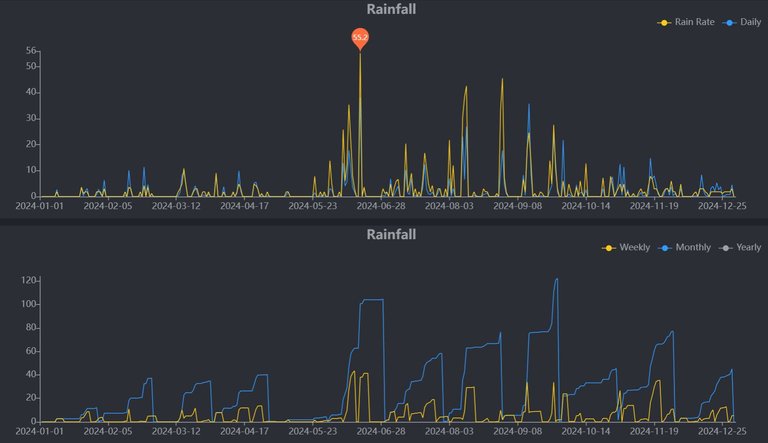
Strongest rainfall: 55.6mm/hr on 17th June. I remember this. Crazy rain, everywhere flooded.
Rainiest month: September, 122.3mm of rain accumulation during the month.
Dryest month: May, 4.3mm of rain. Almost nothing.
2024 Rainfall graphs
Wind
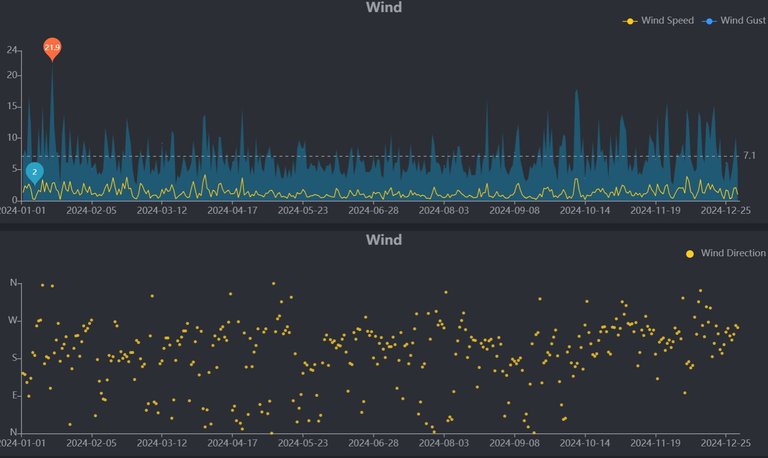
Strongest wind gust: 21.9m/s(49mph) on 16 January. The wind has surely been stronger, but some trees sometimes block wind gusts.
Windiest month: January, avg wind speed 5.9m/s(13.2mph)
Most quietest month: June, avg wind speed 3.8m/s(8.5mph)
2024 wind speed and direction chart
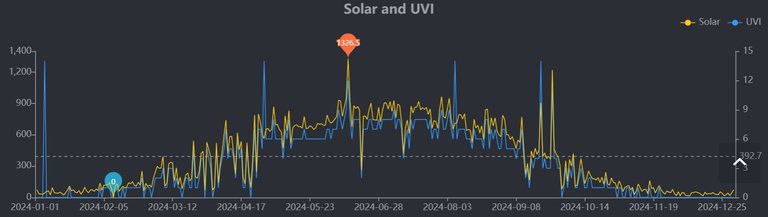
Sun Energy
As you can see, it's high in summer months and goes down to almost nothing deep in the winter.
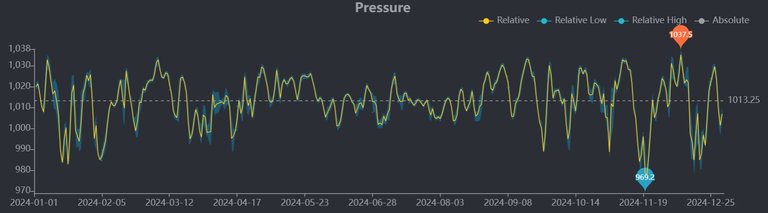
Air Pressure
Let's add this one too. As you can see, the air pressure stays fairly constant through the summer but fluctuates a lot during the other seasons. This is because low-pressure systems hit a lot often hit outside the summer, storms, and so on.
On 20th November, the air pressure fell to 969.9hPa, which is really low.
Well, I hope it was somewhat interesting to see the yearly weather data where I live. It is definitely interesting for me to see. Let's see what records break in 2025...