Federal Reserve stays on track and markets cheer. Cannabis makes more drinks headlines. Coffee and South Africa continue to slide - buying one and selling the other. Hedge funds underperform the markets - time to take profits.

Portfolio News
Market Jitters - Tariff Tantrum Markets shook off the blues and made record highs (again).
The media are desperately trying to talk things down. The divergence between US markets and the rest of the world has them redefining the wall of worry factors - the rest of the world is going to drag the US down.
Most important news of the weekend was the words of Jay Powell, Chairman of the Federal Reserve. He was a little quieter about US economic growth BUT he was clear that the Fed was on track on gradual rate hikes with two still on the cards for 2018. The Jackson Hole conference did hone in on TRADE as being the biggest risk to the world economy.
Cannabis Carnival UK drinks producers, Diageo (DEO), announces they are in talks to acquire a cannabis producer. No details given.

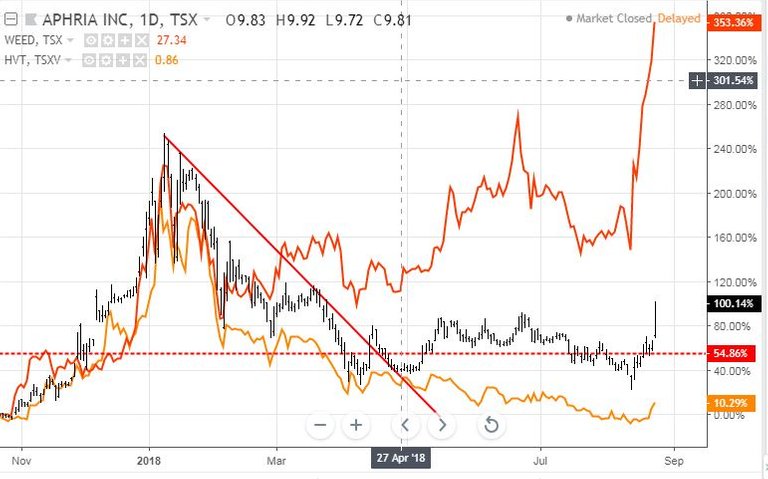
This follows on the increased investment by Constellation Brands (STZ) in Canopy Growth reported in TIB281. Biggest mover in my portfolios was medicinal marijuana stock, Aphria (APC.TO) dragging my investment into positive territory quite dramatically. There is still some way to go with Aphria (black bars) lagging Canopy Growth (WEED - top line) by 250 points but still ahead of my other holding Harvest One (HVT - lower line). Note: all in Canadian Dollars
https://www.investors.com/news/marijuana-stocks-higher-diageo-talks-weed-producers/
Bought
ETFS Coffee ETC (COFF.L): Coffee. Who would want to be a farmer? Costs go up but prices just do not seem to be following. And the US Dollar strengthens. I have been invested in coffee for some time - the monthly chart (each bar is one month) shows my entry points based on price breaking up through a resistance level. The trade looked god for a few months and then fell over.
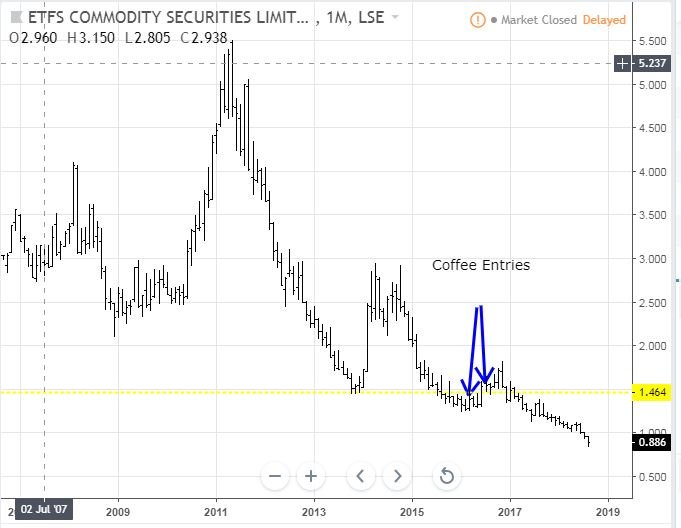
Why enter a new trade now is a good question? The monthly chart looks like a bottomless cup telling one about growing supply and demand not growing fast enough. The daily chart tells me what I saw in Thursday trade - a reversal. I put on a small trade in one portfolio which has no exposure and am hoping - nothing more than that. The chart shows the last 12 months - if price gets back to the 12 month highs the trade wins 62%.
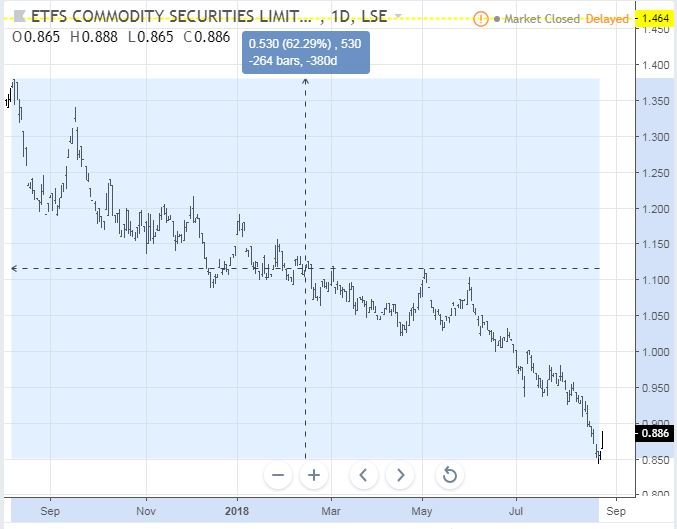
Harvesting season in South America is now complete (it was a record season) though production did not grow faster than demand. This trade is all about prospects for the next season.
https://apps.fas.usda.gov/psdonline/circulars/coffee.pdf for an overview of the market
EDIT: Read this post before you follow this idea - big red flags for the unwary
https://steemit.com/investing/@deathcross/deadly-coffee-with-cocoa-flavour
Sold
Goldman Sachs Hedge Industry VIP ETF (GVIP): Hedge Fund. I have had a take profit order sitting just below the 52 week high for some time now. Part of that order was taken up for a 10% profit since November 2017. This ETF invests based on hedge fund section 13 filings. The trade premise was the ETF contained a mix of growth stocks that could outperform the S&P500 (see TIB140 for the rationale). The chart compares ETF performance (black bars) to S&P500 (orange line) from the date of initial performance.
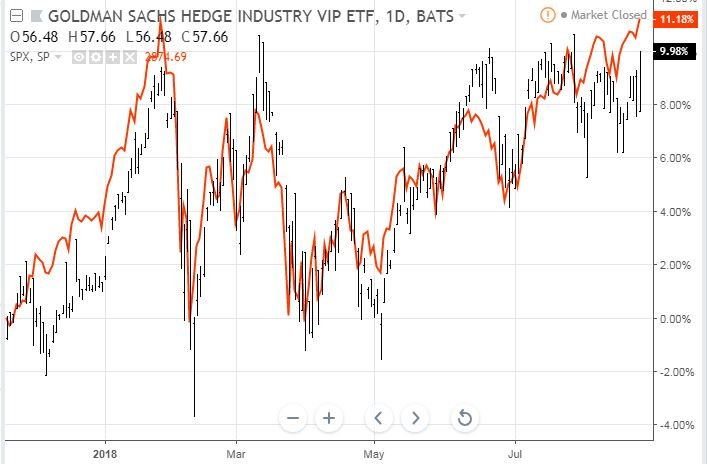
The ETF is more volatile and has had spells when it has been outperforming. Overall, the ETF has underperformed slightly by 1.2% which is a little more than management fees. The more telling part of the chart is the stubborn resistance to break out of the top of the range with 4 attempts since March 2018.
Shorts
iShares MSCI South Africa ETF (EZA): South African Index. South Africa appears to sliding into a big hole. Jacob Zuma is deposed by the ANC on allegations of corruption. The people, who do understand people power, are taking action in violent protests and large scale looting. Farmers are being terrorized.
The new President starts the process of changing the South African Constitution to allow the expropriation of land without compensation. Either he is addressing the problems or he is distracting attention from the corruption issue. In the last two weeks, there have been two large game farms bought by the government on a forced sale basis for less than fair market value = before the law change has been made. This is the start of a major breakdown on the key underpinnings of the South African economy - a stable agricultural base for food and exports. The history of land redistribution in Zimbabwe is testament to what happens. Zimbabwe is now a net food importer having once been a net food exporter.
How to trade the idea?
- Short specific South African stocks
- Short a South Africa ETF
- Buy put options on the ETF
- Short the currency
- Buy options against the currency.
The easiest way would be to short a South Africa ETF. Carry costs are a factor with fund flows being negative over the last 6 months raising stock borrowing costs and a 2.6% dividend yield to fund.
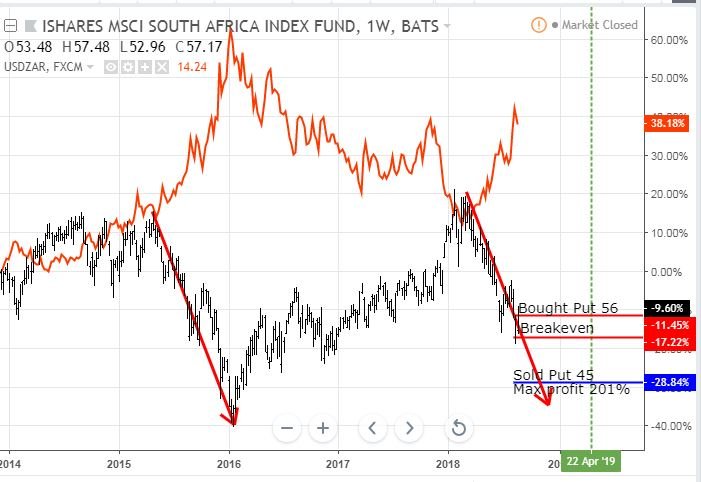
On the options side, there are options available going out to April 2019. Implied volatility is high and open interest is low. I looked at a bear put spread with the bought leg one strike out-the-money ($56). I bought a 56/45 spread for a net premium of $3.65 (6.5%) offering maximum profit potential of 201% if price drops below $45 on or before expiry. [Means: Bought strike 56 put options and sold strike 45 put options with the same expiry]
Let's look at a chart which shows the bought put (56), and breakeven as red rays and the sold put (45) as a blue ray with the expiry date the dotted green line on the right margin.
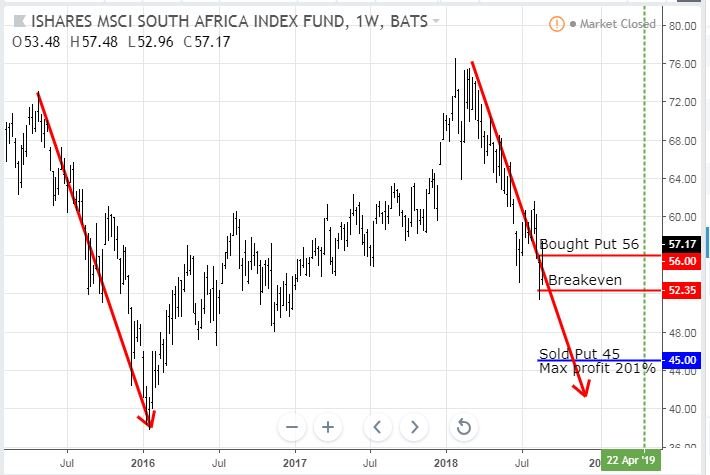
Price is already making its journey downwards from the 2018 highs and the ousting of President Jacob Zuma. It has the same steepness and shape as the collapse in late 2015 - continue that and the trade will reach the maximum profit comfortably before expiry and maybe even during 2018. Since I put this trade on the price has moved up (from $56.09 to $57.17). I will be reviewing this to identify whether to scale in.
There are a few risks in the trade. One of those is that it takes longer than the 8 months to expiry for the land reforms to be actioned. For that reason, I explored currency options where I can buy 12 months to expiry call options on USDZAR. On Friday, I bought a strike 14.268 call option for a premium of 1.4267 (10%). Let's look at the chart which shows the bought call (14.268), breakeven and 100% profit as blue rays with the expiry date the dotted green line on the right margin.
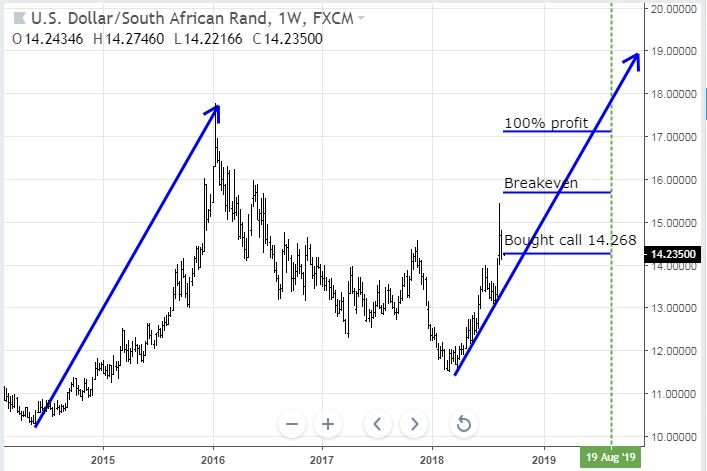
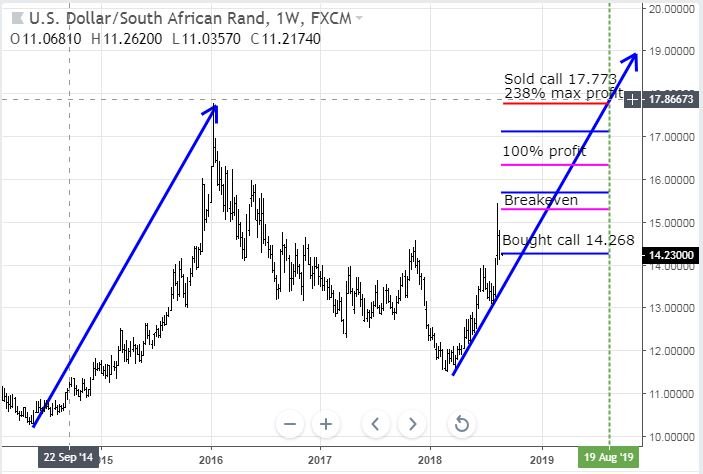
Price is moving up more steeply than it did from the late 2014 correction. A repeat of that run will see the trade pass 100% profit comfortably before expiry but not get to 200% which is what the ETF trade will do. The advantage of this trade is that it is a direct translation of the market views on the economy and it has 4 more months of time. The big disadvantage of the trade is that it is paired with the US Dollar. If the Federal Reserve does not make the expected rate hikes in the next 12 months the US Dollar will weaken. This step back analysis has given me the insight to improve the trade. The 100% profit level is just below the previous high. The right hand blue arrow intersects the expiry date line at 17.773. If I sell a call at that level I can reduce the net premium and improve profit potential.
That is what I did today. I sold a 17.773 strike call option with the same expiry date for $0.39096 premium which brings my net premium down to 7.3% of strike compared to the 6.5% I paid for the ETF trade. That is a small increase in premium percentage for another 4 months of time. I have added this to the new chart. The red ray is the sold call which has a 238% maximum profit potential. The pink rays move downwards showing improved breakeven and 100% profit levels.
These two trades may simply be versions of the same thing. If I plot the ETF price (black bars) against the USDZAR currency (orange line) you will see that the trades are very much the inverse of each other.
As the currency weakens (orange line goes up) the ETF price goes down (black bars). That tells me that either trade works - choose the cheaper one for the time gained.
The next thing to understand is what the ETF actually is. South Africa is one of the world's largest producers of gold and a number of other minerals. The ETF has only 6% invested in materials and 8% in energy (some of that will be uranium). Level one insight is the trade will not be influenced strongly by the gold price. It is dominated by consumer and financials stocks which is encouraging.
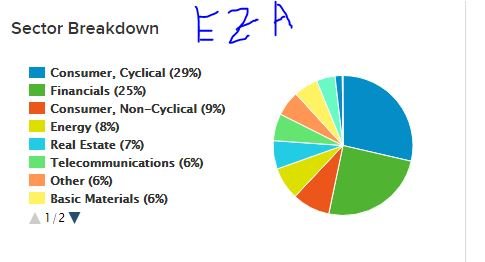
If the land grab stuff does flow it will hit consumption spending and credit quality hardest. There is one piece of detail that is hidden in the numbers. That 29% in Consumer Cyclical includes 23% coming from one stock (Naspers).
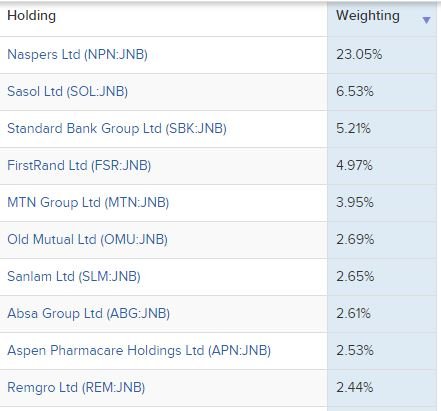
Naspers owns 33% of Tencent, the Chinese Internet business. That means that at least 8% of this ETF is South African Rand hedged and it is more strongly tied to the Chinese economy than the South African economy. This suggests to me another reason why the currency trade is more pure than the ETF trade.
Income Trades
One more income trade on Friday.
ETFMG Prime Cyber Security ETF (HACK): Cybersecurity. Sold September 2018 strike 40 calls for 0.64% premium (0.87% to purchase price). Closing price $39.06 (new trade). Price needs to move another 2.4% to reach the sold strike (new trade). Should price pass the sold strike I book a 39% capital gain.
Price in this ETF jumped on Friday after FireEye (FEYE) announced earnings.
Cryptocurency
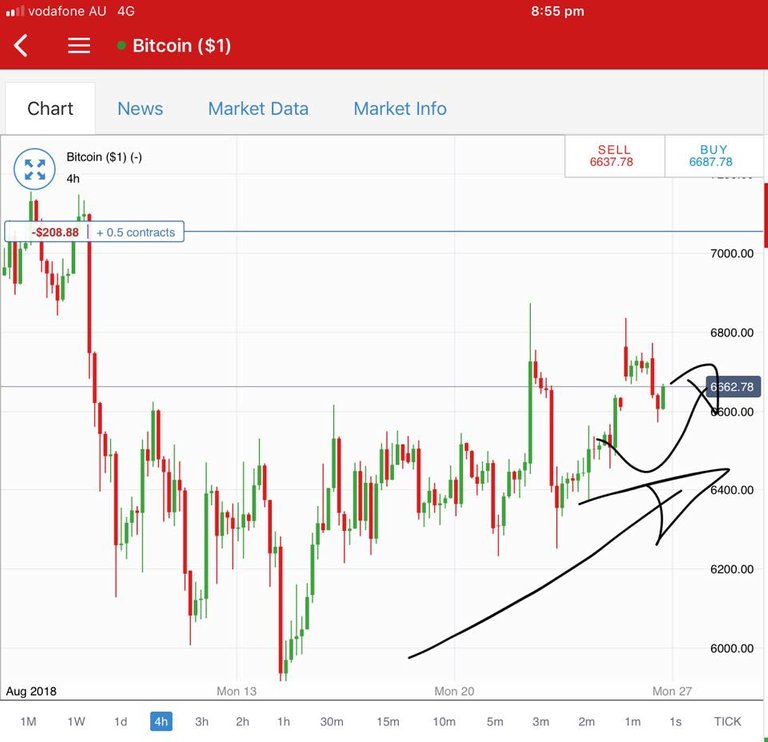
Bitcoin (BTCUSD): Price range for the weekend was $355 (5.5% of the low). The market absorbed the news of the SEC decision well and pushed up through the support level and reversed on a level it has begun to respect in the last 2 months (around $6800) (the long pink ray - new to the chart).
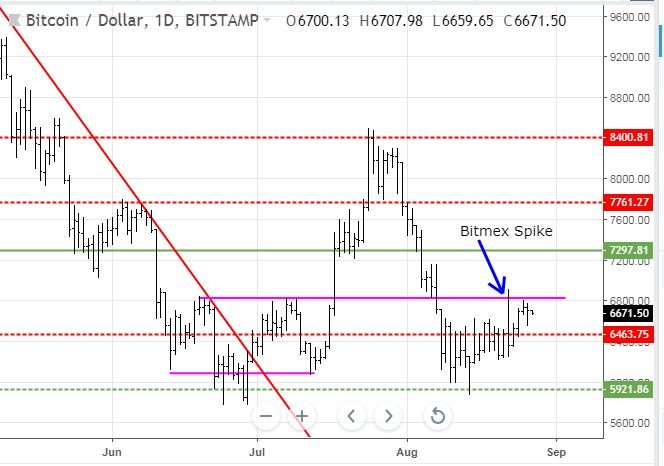
There was news over the weekend that the SEC was reconsidering its thinking about the Bitcoin ETF applications decided on this week.
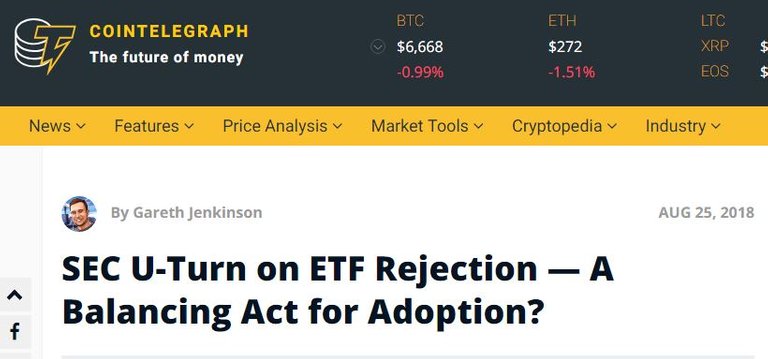
This does not surprise me. I thought the SEC was a bit hasty, or even clutching at straws, in its latest ruling. The applications were based on already regulated futures contracts and not on physical holdings of Bitcoin. My sense is that they will wait a little longer for these markets to mature and for there to be more data to analyse - the futures only listed in December 2017.
https://cointelegraph.com/news/sec-u-turn-on-etf-rejection-a-balancing-act-for-adoption
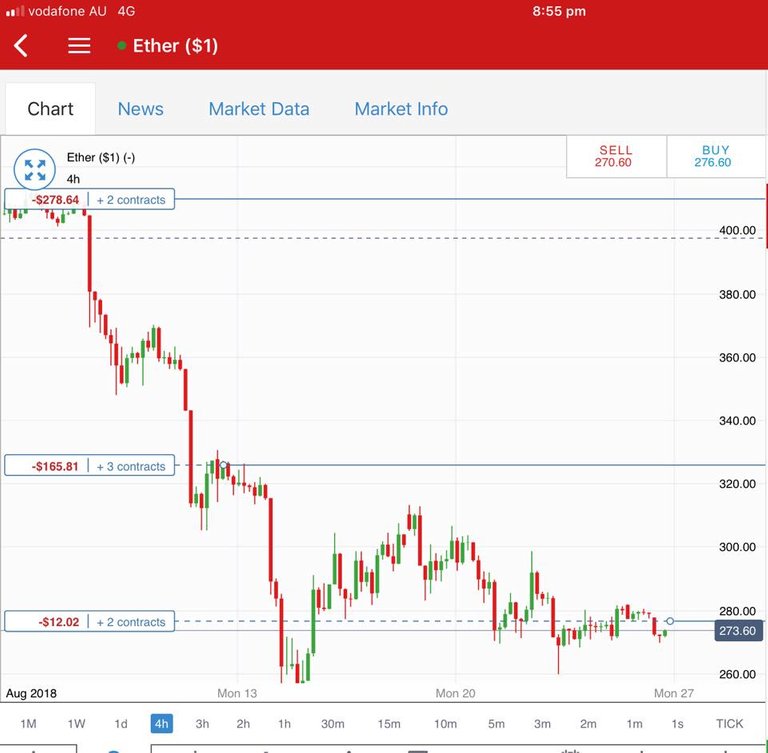
Ethereum (ETHUSD): Price range for the weekend was $13 (4.8% of the low). ETH went to sleep over the weekend tracking sideways along the support line.
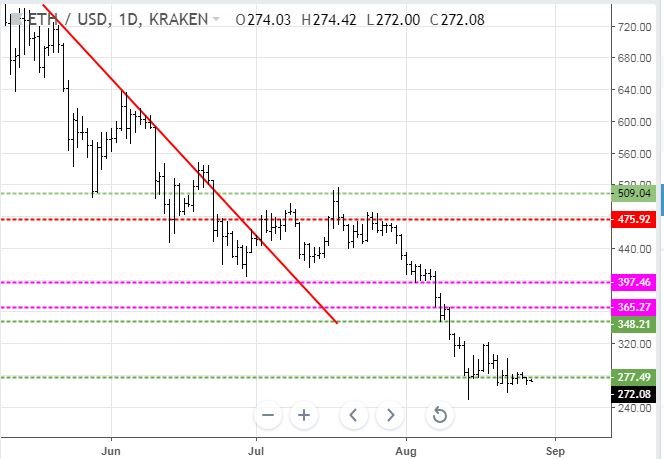
With a clear price reversal on BTC
I added another contract in my IG markets account on ETH just around the support line at $275.
CryptoBots
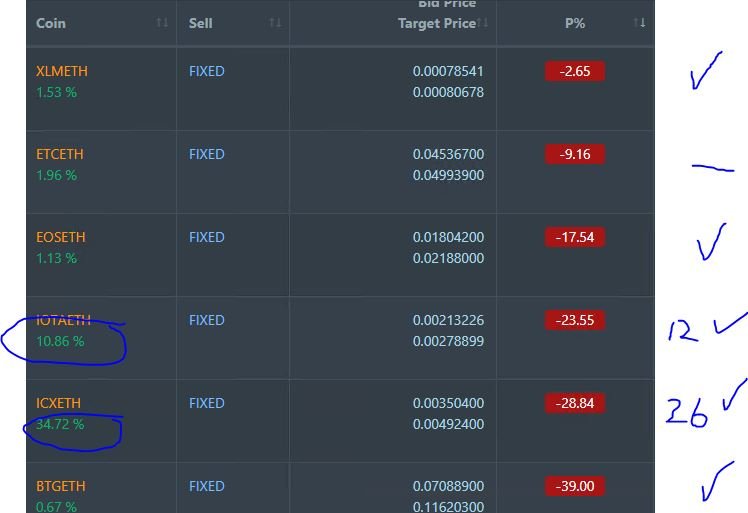
Outsourced Bot No closed trades. (213 closed trades). Problem children stayed at 18 coins. (>10% down) - ETH (-60%), ZEC (-62%), DASH (-72%), LTC (-50%), BTS (-51%), ICX (-69%), ADA (-65%), PPT (-75%), DGD (-75%), GAS (-83%), SNT (-58%), STRAT (-74%), NEO (-81%), ETC (-48%), QTUM (-76%), BTG (-74%), XMR (-48%), OMG (-65%).
A mixed cycle with coins moving up and down by 1 or 2 points only. ETH (-60%), LTC (-50%), BTS (-51%) all trade worse one level and ICX (-69%) was the biggest improver letting go of 80% and 70% down. GAS (-83%) remains the worst.
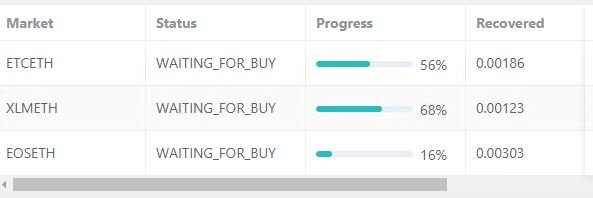
Profit Trailer Bot Seven closed trades (1.32% profit) bringing the position on the account to 1.50% profit (was 1.42%) (not accounting for open trades).
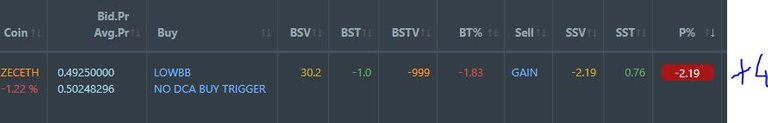
Dollar Cost Average (DCA) list remains at one coin with ZEC improving 4 points
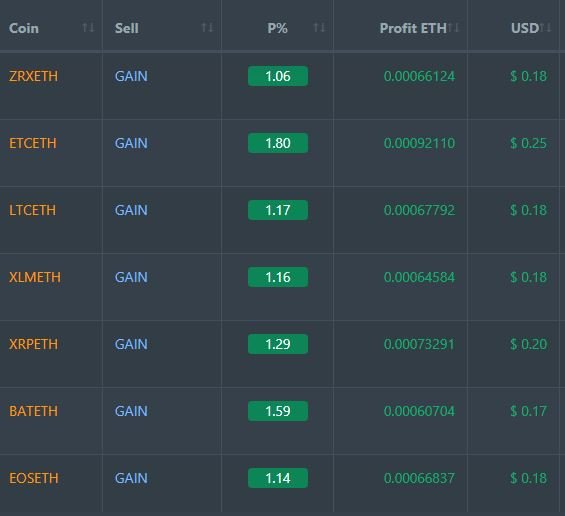
Pending list reduces to 12 coins with ZRX departing and with 11 coins improving, and 1 coin trading flat. ICX was the biggest improver in solid company of improvers. This sort of surge in altcoin buying is very common when BTC improves or holds a level.
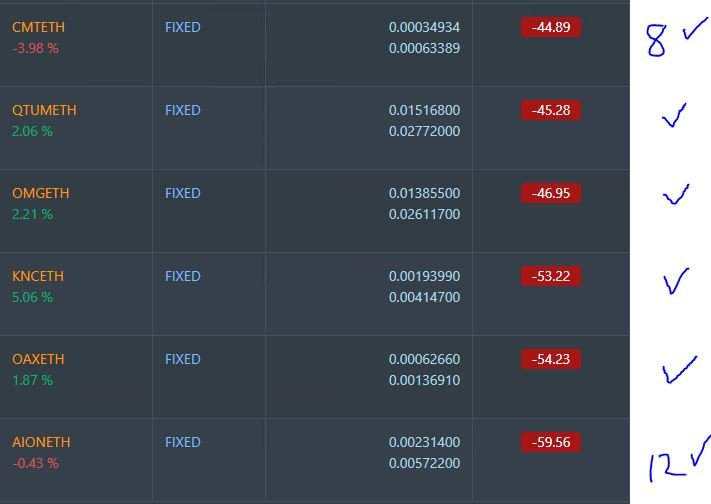
PT Defender completed defence on ZRX and made further progress on the other 3 coins. I will get it working on the next of the pending list.
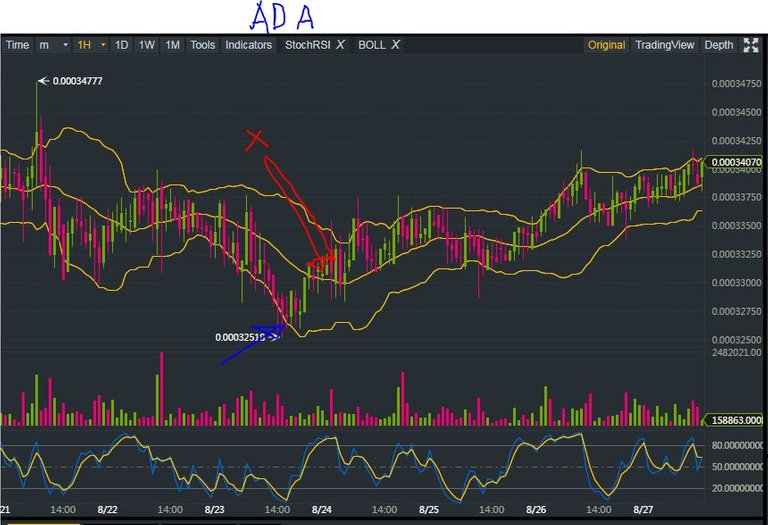
New Trading Bot Trading out using Crypto Prophecy. I completed 3 trades to continue trading out this account - all 3 trades closed profitably (ADA, NAS, TRX). I made a video outlining the process I am using. The process brings together the Crypto Prophecy trade ideas and a confirmation using Bollinger Bands. I am, still working out a set exit policy and a strategy. At the moment I am using this for scalping type trades on a one hour chart. The bots are all trading on 5 minute charts.
The ADA trade that closed shows the potential. Trade entry idea is to track price as it moves outside the lower Bollinger Band. What I am aiming to do is grab profits on half the trade when price crosses the moving average at the centre of the bands and then let the other half run to the top of the bands. This chart shows there is more potential upside - the challenge is working out a strategy to capture that.
Watch the video here
https://mymark.mx/CryptoProphecy to buy Crypto Prophecy - I bought only the front end product. I figure I know enough to work out my own strategy.
Currency Trades
South African Rand (USDZAR): Reported in Shorts above.
Forex Robot did not close any trades and is trading at a negative equity level of 11.0% (higher than prior day's 9.1%).
Outsourced MAM account Actions to Wealth closed out 3 trades for 0.32% profits for the two days
Cautions: This is not financial advice. You need to consider your own financial position and take your own advice before you follow any of my ideas
Images: I own the rights to use and edit the Buy Sell image. News headlines come from Google Search, Wall Street Journal and CoinTelegraph.com. South Africa ETF charts come from ETFdb.com. All other images are created using my various trading and charting platforms. They are all my own work
Tickers: I monitor my portfolios using Yahoo Finance. The ticker symbols used are Yahoo Finance tickers
Charts: http://mymark.mx/TradingView - this is a free charting package. I have a Pro subscription to get access to real time forex prices
Crypto Trading: get 6 months free trades with Bitmex for leveraged crypto trading. http://mymark.mx/Bitmex
August 23-24, 2018
Great investment thesis on the South Africa trade. I like the way you set it up and consider all the options. For example, sometimes I would fail to look at the ETF components which reveal that substantial exposure to Tencent and China. Thanks for your work!
It does help in that case that I came originally from South Africa.
It's amazing that your post @carrinm, in aceh marijuana and coffee is of good quality, only marijuana has not been permitted by the government to embed.
Same in Australia though medicinal marijuana is being trialed
Hopefully successfully test it @carrinm.
Tons of interesting info here.
Packed. Trying to keep my learn on.
Thanks for the share.
So informative and initiative content,keep it up boss
Posted using Partiko Android
nice information and big information and thank to share with us
Nice information
And big information and
Thank to share with us
- sardaradeelkhan
I'm a bot. I detect haiku.