Your standard pressure-building triangle, with higher lows and equal tops:
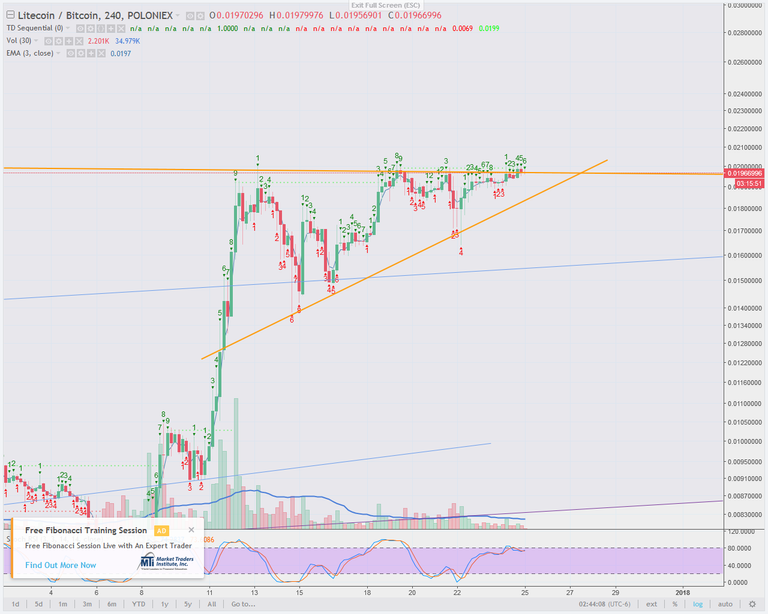
But this is with a large flagpole, and straight off of a false breakdown which I blogged about previously.
Ok, that's just the teaser. Look at this one
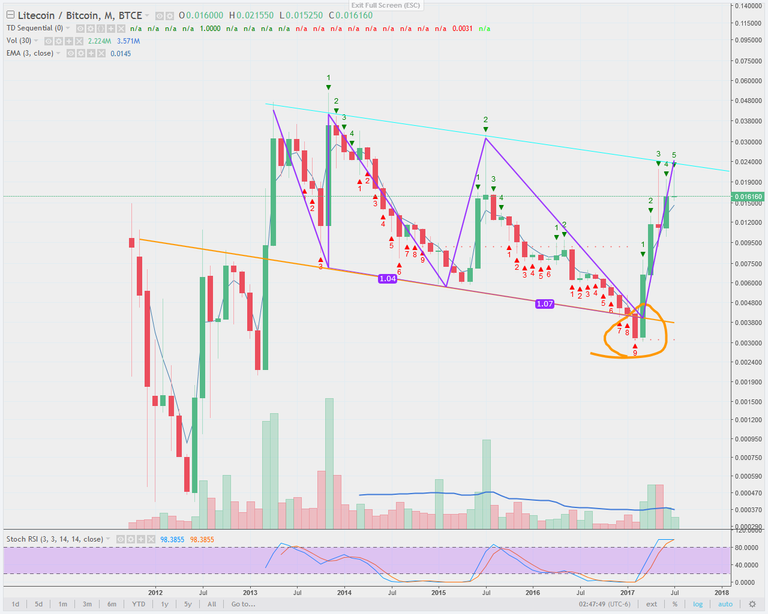
Yeah that's right, 7 years. I gigantic flag with a "3 dives" pattern. Add on the flagpole and you get a move to .04 bitcoins, 600 dollars, or possible double that! I circled the false breakdown in that chart, which implies you are likely to break above the previous range.
Note: in between the two charts litecoin pulled back a little from the upper line and has come back to it.