For those who would like to visualize Hive by the block and who are currently running a hived node of any kind, this is likely for you.
Introducing hived-exporter, a metrics exporter that collects block statistics and other info from a hived node that can be used to populate a Prometheus-compatible database.
What it collects
The main metrics node operators are likely interested in that are collected are block stats. These contain uncompressed block sizes, execution performance as well as general info on transaction statuses on pre and post-validation of a block.
The exporter receives block stats notifications on every block from a PUT request (called by a configured hived node) with a JSON body that looks something like this:
Click to reveal JSON
{
  "time": "2024-02-24T12:02:17",
  "name": "Block stats",
  "value": {
    "block_stats": {
      "num": 83087470,
      "lib": 83087469,
      "type": "p2p",
      "id": "04f3d06e68703071c5068418b1af4816cfe766b4",
      "ts": "2024-02-24T12:02:18",
      "bp": "ausbitbank",
      "txs": 64,
      "size": 16746,
      "offset": -114131,
      "before": {
        "inc": 78,
        "ok": 78,
        "auth": 0,
        "rc": 0
      },
      "after": {
        "exp": 0,
        "fail": 0,
        "appl": 0,
        "post": 0
      },
      "exec": {
        "offset": -118048,
        "pre": 160,
        "work": 3757,
        "post": 52,
        "all": 3969
      }
    }
  }
}
As for what each of them means, I recommend taking a look at this file, particularly the block_flow_control::get_report(report_type rt) function.
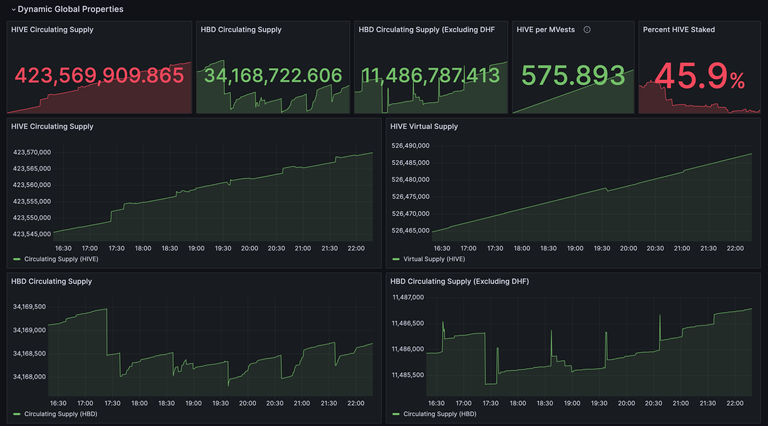
On top of that, the exporter also collects general data from dynamic global properties, DHF balances as well as any Hive account that you wish to collect metrics for.
What it doesn't collect (for now)
Some metrics that I could not obtain accurately from hived notifications such as peer counts, CPU/memory/bandwidth usage, shared memory db lock times and perhaps fast-confirm related details. The hived_benchmark notification may provide some info regarding this, however it does not provide anything useful if it is handled by a separate exporter process.
These metrics are probably better exported directly by a hived plugin, unfortunately this is not within my skillset to contribute at this moment.
Setting up
hived will have to be configured for the exporter to receive notifications on block stats, in the config.ini file as follows:
notifications-endpoint = 127.0.0.1:8088

block-stats-report-type = FULL
block-stats-report-output = NOTIFY
Once that is in place, clone the repo and start the docker compose. This will create two instances of the exporter, one of which exports block stats every 3 seconds (at localhost:8088/metrics) and the other exports data from hived APIs every 30 seconds (at localhost:8087/metrics). VictoriaMetrics is also included in the compose to scrape the exported metrics.
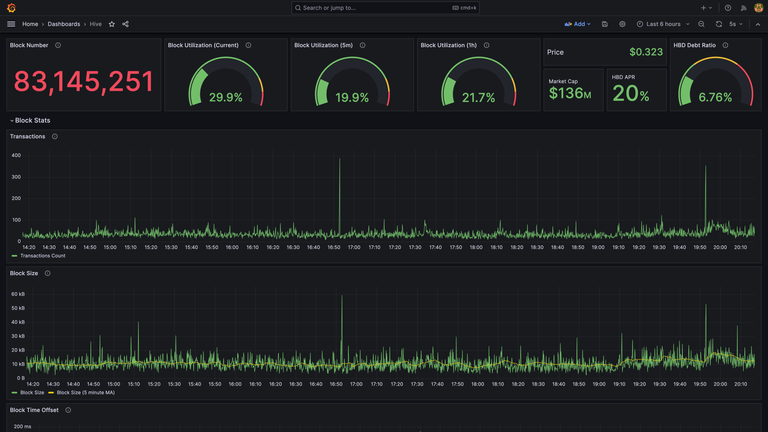
Visualizing them
The collected data can be displayed in a Grafana dashboard, which should give you a good idea about the latest state of the network.
More screenshots in addition to the above:
 |  |
|---|
5 minute moving averages (MA) for certain graphs may be shown by clicking on the legend, if the large fluctuations from block to block makes them hard to read.

As always, you may customize the dashboard to your liking after importing it into Grafana, such as adding more calculated metrics to look at or simply moving the panels around.
Thank you for your witness vote!
Have a !BEER on me!
To Opt-Out of my witness beer program just comment STOP below
View or trade
BEER.Hey @techcoderx, here is a little bit of
BEERfrom @isnochys for you. Enjoy it!Learn how to earn FREE BEER each day by staking your
BEER.Thank you for your witness vote!
Have a !BEER on me!
To Opt-Out of my witness beer program just comment STOP below
View or trade
BEER.Hey @techcoderx, here is a little bit of
BEERfrom @isnochys for you. Enjoy it!Learn how to earn FREE BEER each day by staking your
BEER.