Part Deux
The other half of the top 10 has changed quite a bit since I last charted all of them. EOS now occupies 6th, NEO has dropped down quite a few places, and IOTA has regained 10th spot from Monero.
Let's see if there are any coins here that are more bullish than the top 5. Starting with:
EOS
https://www.tradingview.com/x/cZ6nJNxj/
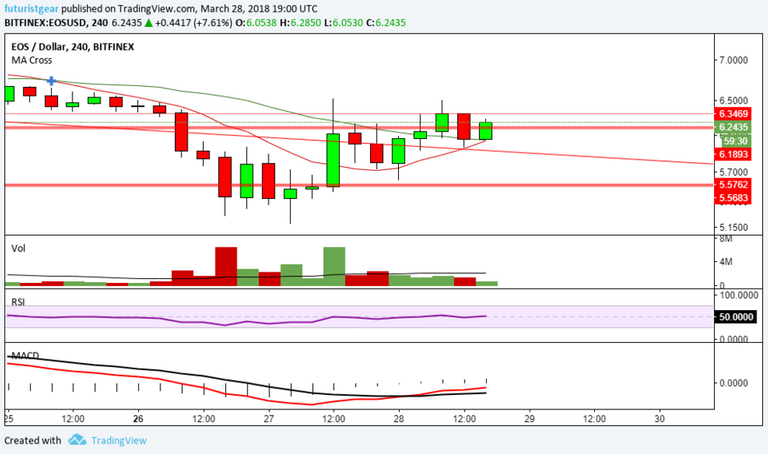
4 Hour Chart
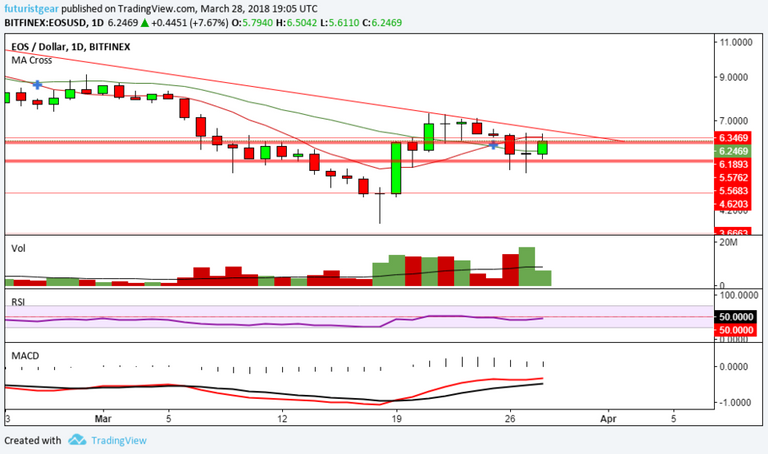
EOS looks pretty strong on the 4 hour chart with the RSI gaining strength and the MACD being on the bullish side currently, and the daily chart:
https://www.tradingview.com/x/f1NO2HlI/
Daily chart
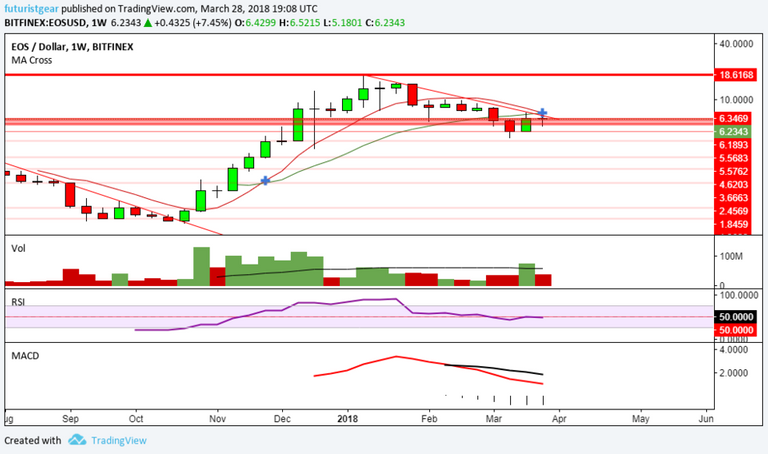
Is also looking pretty bullish right now. Despite that, the weekly one still shows signs that the correction could continue as we can see with the MACD here:
https://www.tradingview.com/x/8omLQC0g/
Weekly chart
The RSI is neutral/borderline weak here too, as it is on the daily, and we're still clearly in a downtrend.
The key support level for EOS seems to be at around $4.60, and the major resistance is that downtrend line mentioned above.
Cardano
https://www.tradingview.com/x/NDkWu8wp/
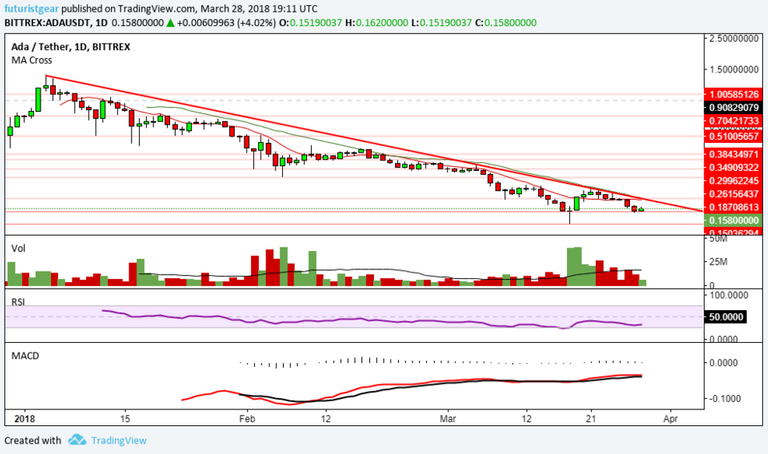
Daily Chart
Cardano is also clearly stuck in a downtrend much like EOS, but there seems to be some bullish divergence on the daily MACD. That said, it still looks weak on the RSI and is clearly following the broader market at the moment so it might just drop further still.
Major support seems to be at 12 cents, so that's the main level to watch if it drops again, with the downtrend line being the main resistance here too.
Stellar
https://www.tradingview.com/x/umOVCc9x/
Daily Chart
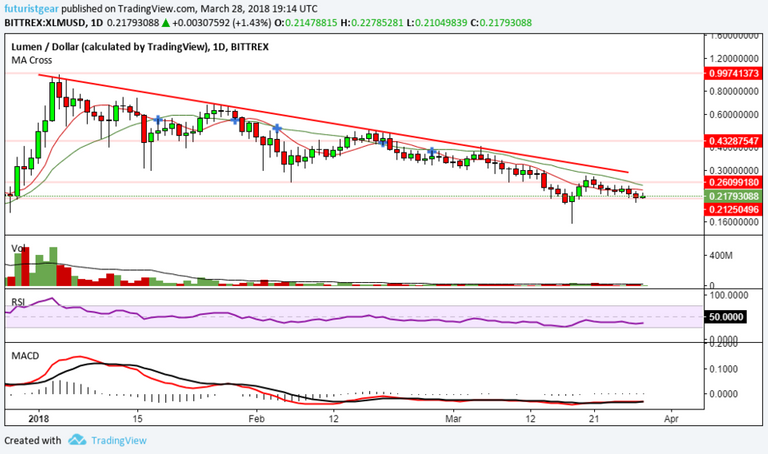
Lumens are looking much like Ripple, with both the 4 hourly and daily chart above showing signs that sideways action could be the most likely course short term, but...
https://www.tradingview.com/x/Os7bglJ9/
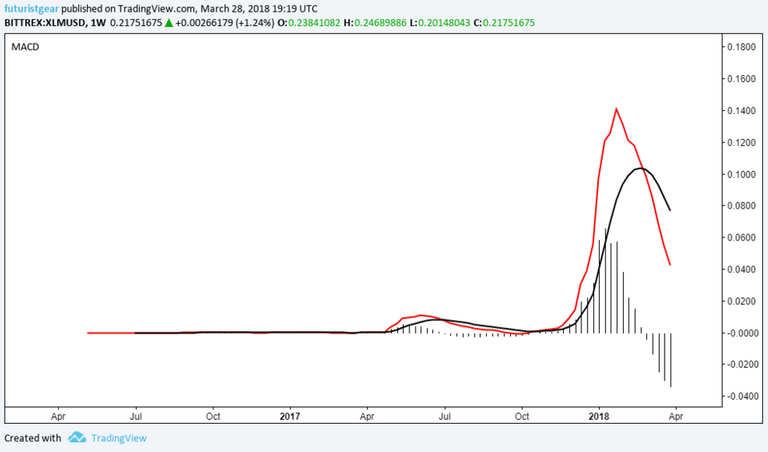
Weekly XLM MACD
The MACD on the weekly chart still looks like it has plenty of room to continue correcting.
The $0.21 level is currently providing support, so it will be wise to keep an eye on that figure and see if it can be held despite the longer term chart still looking bearish right now.
NEO
https://www.tradingview.com/x/HbCrpVKi/
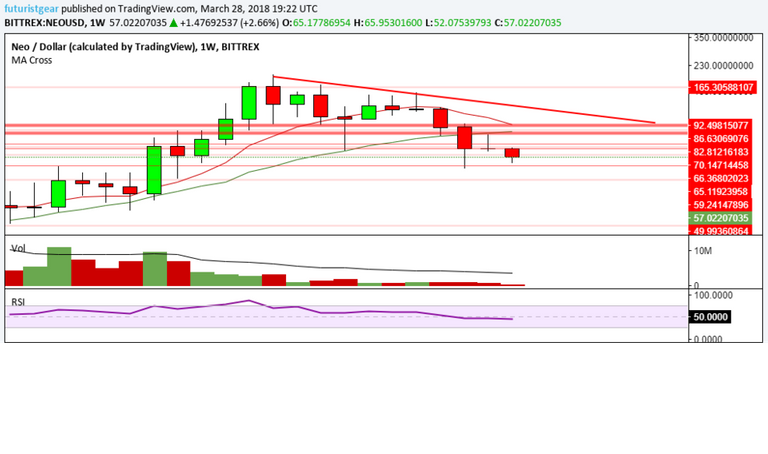
Weekly NEO Chart
NEO has been holding up above the $50 marker for the most part, but like many other coins in the top 10; the picture still looks pretty bad on the longer term weekly chart above.
Hopefully that $50 can hold moving forward, if not the next level to watch will be the $40 number.
IOTA
https://www.tradingview.com/x/7QX2m4dw/
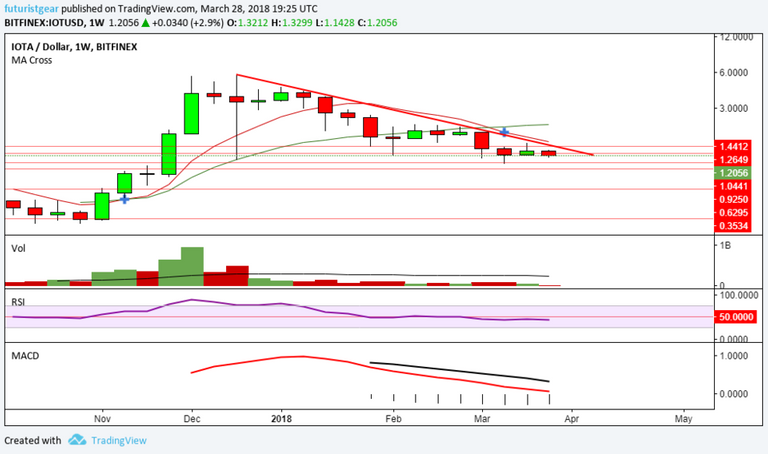
Weekly IOTA Chart
IOTA is holding up above the key $1 level, but things look pretty bad on the weekly chart here still too, so I'm not feeling too confident that will last moving forward.
We could see a battle play out between that $1 level and the downtrend line at some point soon, and it will be interesting to see which of the 2 wins that battle!
Summary
I wish I could say that things were starting to look more bullish, but apart from some key support levels holding up; the signs on the longer term/weekly charts still look pretty poor to me.
There are clearly some bullish signs on the shorter time frames, but it depends if you want to trade or not I guess! I said earlier I'm treading with caution, so if you're trading I'm not going to be joining you. :-D
Any thoughts on the above? Spot something my novice eyes have missed? Let me know below!
Thanks for viewing!
Want more technical analysis and crypto related posts? See also: @toofasteddie, @gazur, @ew-and-patterns, @pawsdog, @cryptomagic, @exxodus, @beiker, @lordoftruth, @masterthematrix, @cryptoheads, @tombort, @maarnio, @steemaze & @briggsy
Not intended as investment, financial, or trading advice. For entertainment purposes only.
