I've analyzed coronavirus cases with Python for data analysis (Pandas) to get more detailed information.
New infections actually stop increasing in China at point of about 81.4K confirmed cases. Italy stay as a new epicenter of coronavirus. Spain has also rapid spread of new confirmed infections, but on last days USA had outrun Spain and took the place after Italy.
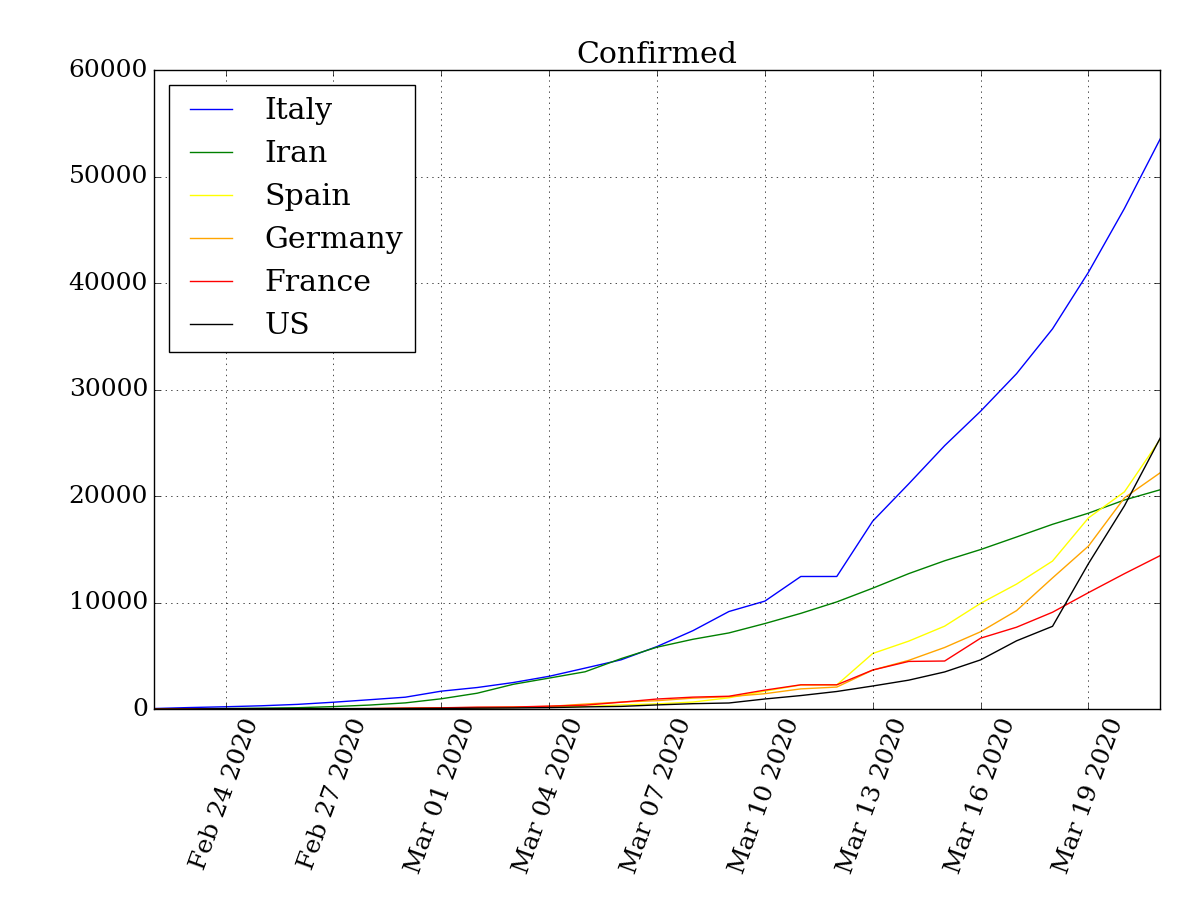
The rate of new cases confirmations still increasing in Italy.
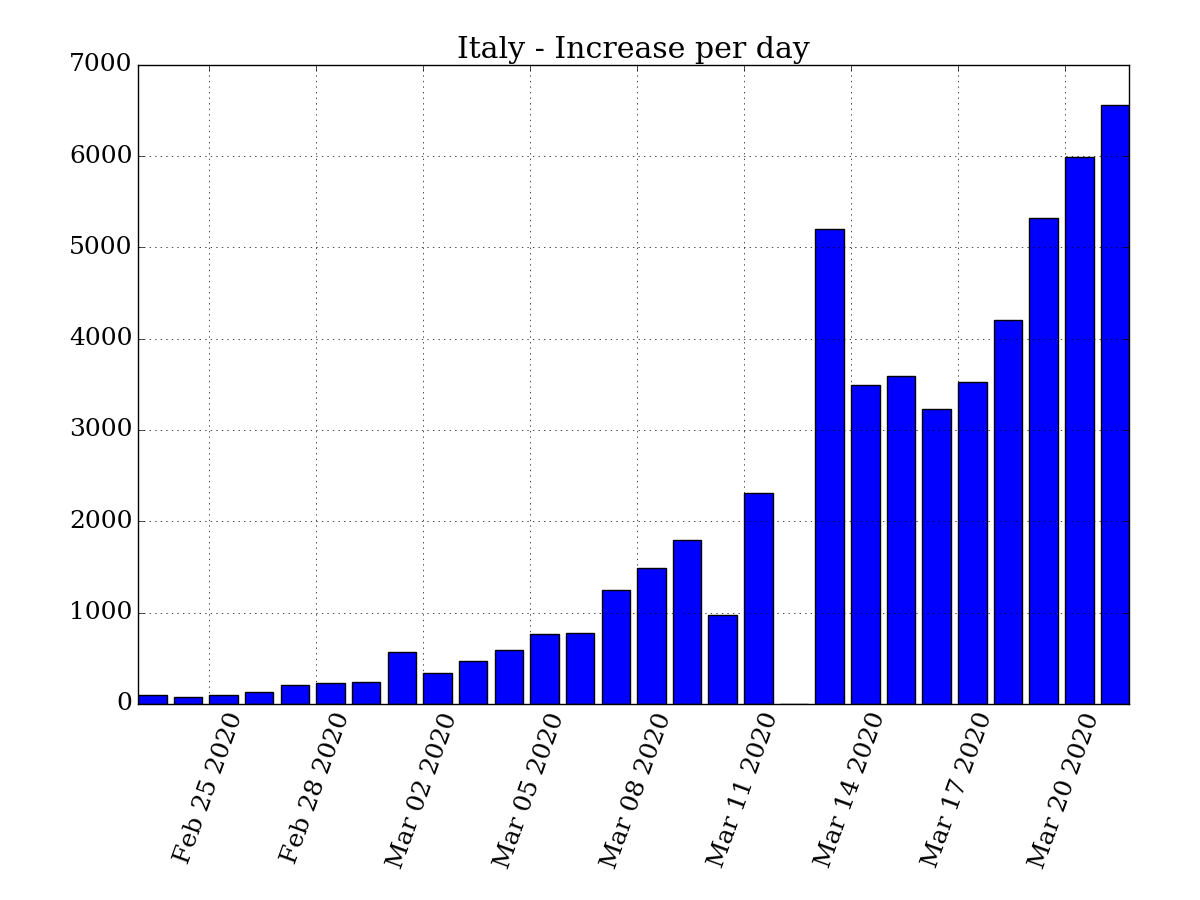
I hope in someday in near future the situation will changed and the rate starts to decline as we see was in China.
Python code:
import pandas as pd
import matplotlib.pyplot as plt

df = pd.read_csv("./csse_covid_19_data/csse_covid_19_time_series/time_series_19-covid-Confirmed.csv")
df.drop(['Lat', 'Long', 'Province/State'], axis=1, inplace=True)
df.head()

df = df.groupby(["Country/Region"]).sum()
data = df.T
data.index = pd.to_datetime(data.index, format="%m/%d/%y")
data = data["2020-02-22":]  # from Feb. 22

plt.plot(data["Italy"], color="blue")
plt.plot(data["Iran"], color="green")
plt.plot(data["Spain"], color="yellow")
plt.plot(data["Germany"], color="orange")
plt.plot(data["France"], color="red")
plt.plot(data["US"], color="black")
plt.legend(loc=2)
plt.title("Confirmed")
plt.xticks(rotation=70)
plt.show()

incr = data.copy()
incr.reset_index
num = len(data.index)

italy = []
for i in range(0,num-1):
    italy.append(incr["Italy"][i+1] - incr["Italy"][i])

plt.bar(data.index[1:], italy)
plt.title("Italy - Increase per day")
plt.xticks(rotation=70)
plt.show()
Novel Coronavirus (COVID-19) Cases, provided by JHU CSSE -> Dashboard
Data source: github