May 7th 2021, Silver Chartbook – Silver eats doubt for breakfast
Gaining certainty about a clear picture of the future is getting more complex by the minute. Data arrives of never-seen occurrences that make it seemingly impossible to know how everything will pan out. President Biden demands higher taxation of the rich and a minimum wage of US$15. News about Silver market manipulation introduces fear into this market sector. Janet Yellen spoke of inflation. Many are talking about a possible hyperinflation. Others however are pointing towards the “Japanization” of America. On top, a recent New York Times headline reads: “Reaching herd immunity is unlikely in the U.S.”. All this noise is creating more confusion and pressure instead of clarity. The good news is: You do not need to know how the future unfolds to preserve your wealth. And Silver eats doubt for breakfast.
Silver prices will continue to rise. Why are we so sure about this? Unlike most who try to gain clarity about how the future might look like, we instead eliminate all scenarios where Silver prices wouldn’t be rising. Even if you are not a specialist in trading fundamentals, by now, it intuitively feels just wrong that central banks put this much freshly printed currency into circulation. Historically, precious metals are the most common safe haven in times of trouble and doubt. This will be no different this time around.
Silver in US-Dollar, Weekly Chart, Last weeks chart:
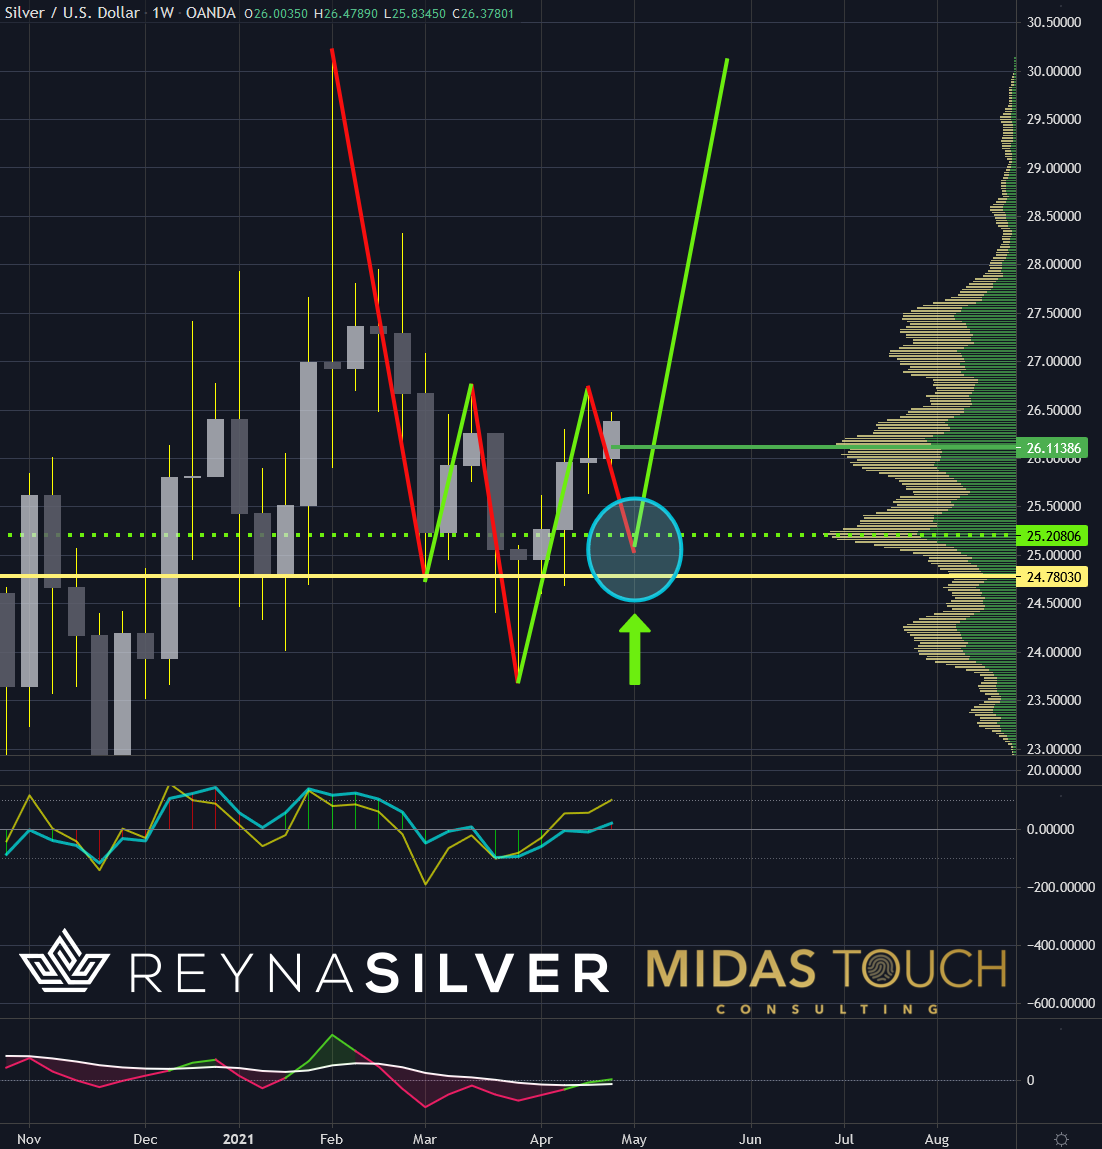
Silver in US-Dollar, weekly chart as of April 29th, 2021.
In last week´s publication, we posted the above chart with this comment:
“We identified the slightly higher probability of prices to advance immediately since we overcame a distribution zone marked with a dark green horizontal line, which now serves as support.”
…and spot on we were:

Silver in US-Dollar, Weekly Chart, Like we hoped:
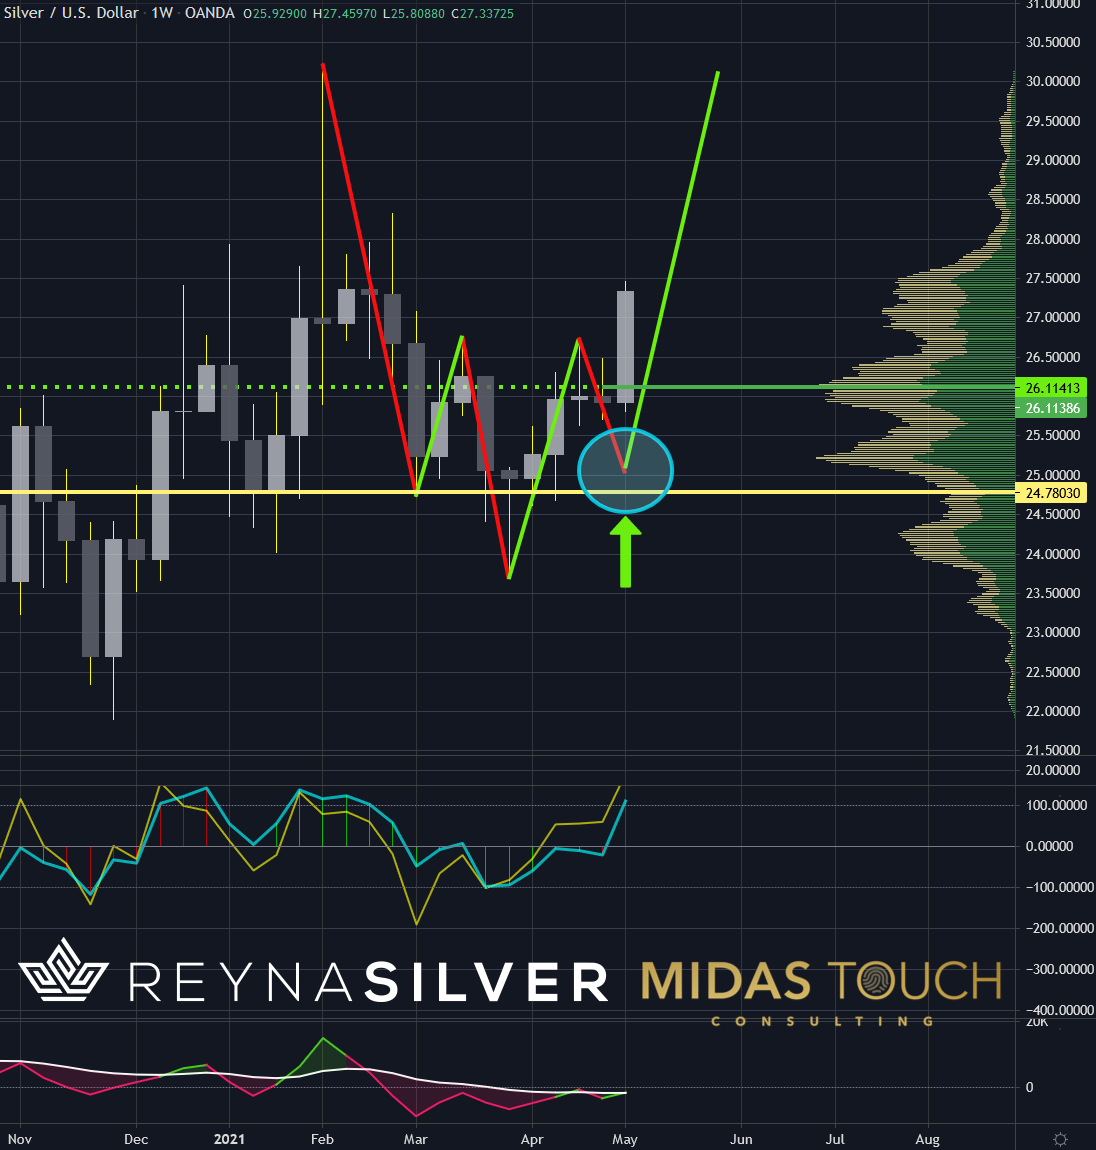
Silver in US-Dollar, weekly chart as of May 6th, 2021.
While these weekly charts might appear somewhat similar, something significant has happened. The following the daily chart shows this more clearly.
Silver in US-Dollar, Daily Chart, Resistance penetration:
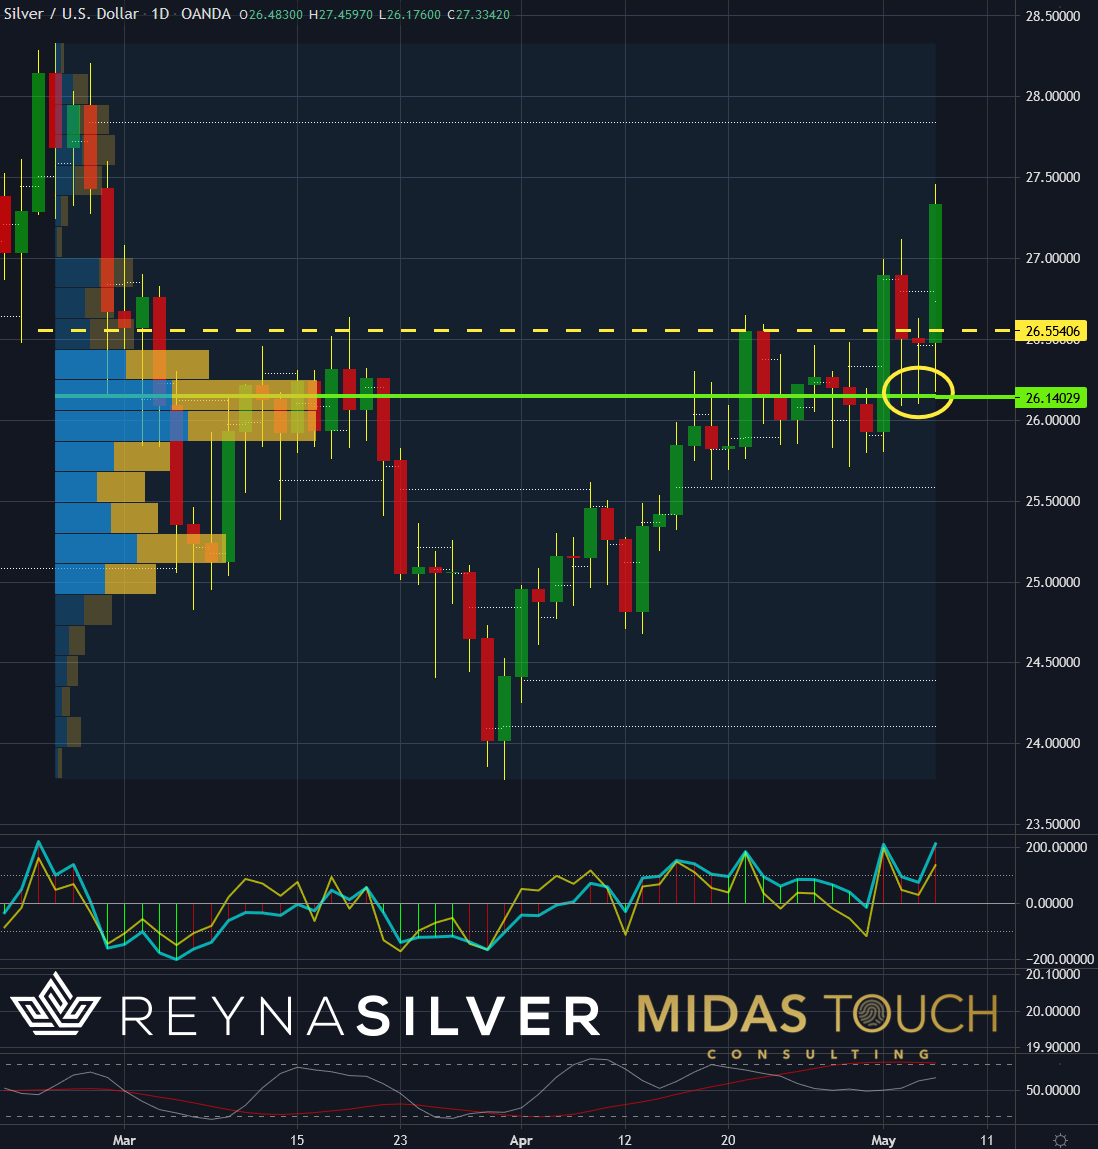
Silver in US-Dollar, daily chart as of May 6th, 2021.
Zooming into the smaller time frame, we can see the significance of last week’s price movement. Not only did the POC (point of control) support supply zone based on volume transaction (green horizontal line) get cemented by three rejected candle wicks, but the original breakout through significant resistance at US$26.55 all the way to prices above US$$27 paves the way to further advances.
Gold in US-Dollar, Monthly Chart, When to cash in some chips:
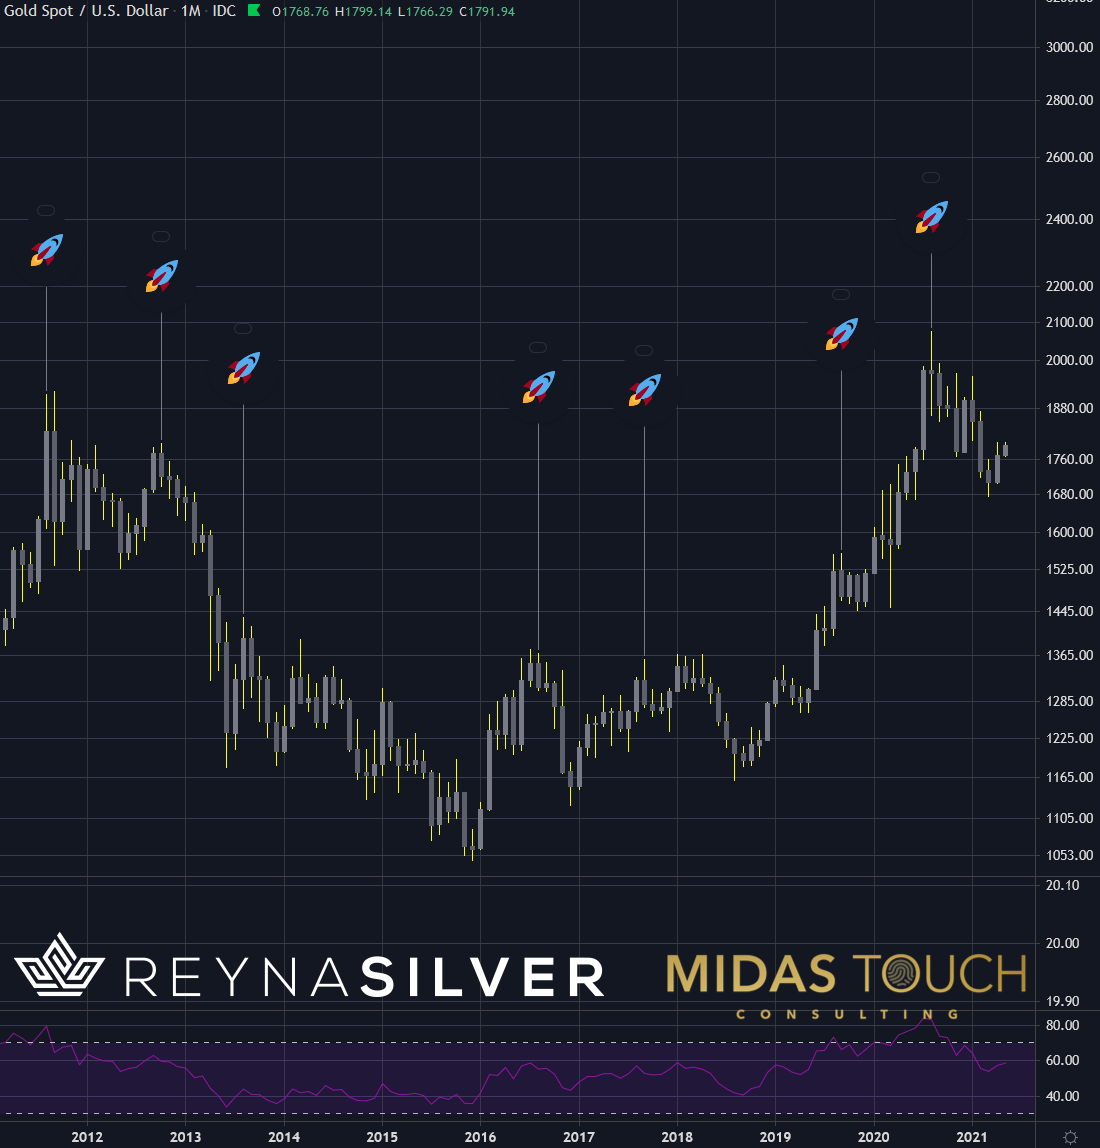
Gold in US-Dollar, monthly chart as of may 6th, 2021.
While entries are essential for risk minimization, exits distinguish the good trader. They should be as such the true focus in one’s trading approach.
Looking at the Gold chart above, the leader of the precious metal sector and as such followed by Silver shows a clear seasonal pattern. We identified a high probability for precious metal prices peaking in the first week of September and will, as such, take partial profits (see our quad exit strategy) at that time from our Silver holdings.
Silver eats doubt for breakfast:
Our mind craves certainties in an uncertain world and even more when predicting an unknown future. It is the process of accepting these uncertainties and applying principles of wealth preservation that supports the outcome of sound investment strategies.
One of these principles is the process of elimination. We were asking if there is a scenario where Silver wouldn’t rise, which is much more fruitful than trying to predict a precise model of the future. We literally couldn’t come up with a scenario that would work against the Silver price advance over the long term.
Feel free to join us in our free Telegram channel for daily real time data and a great community.
If you like to get regular updates on our gold model, precious metals and cryptocurrencies you can subscribe to our free newsletter.