Technical Analysis (4H Chart –BTC/USDT)
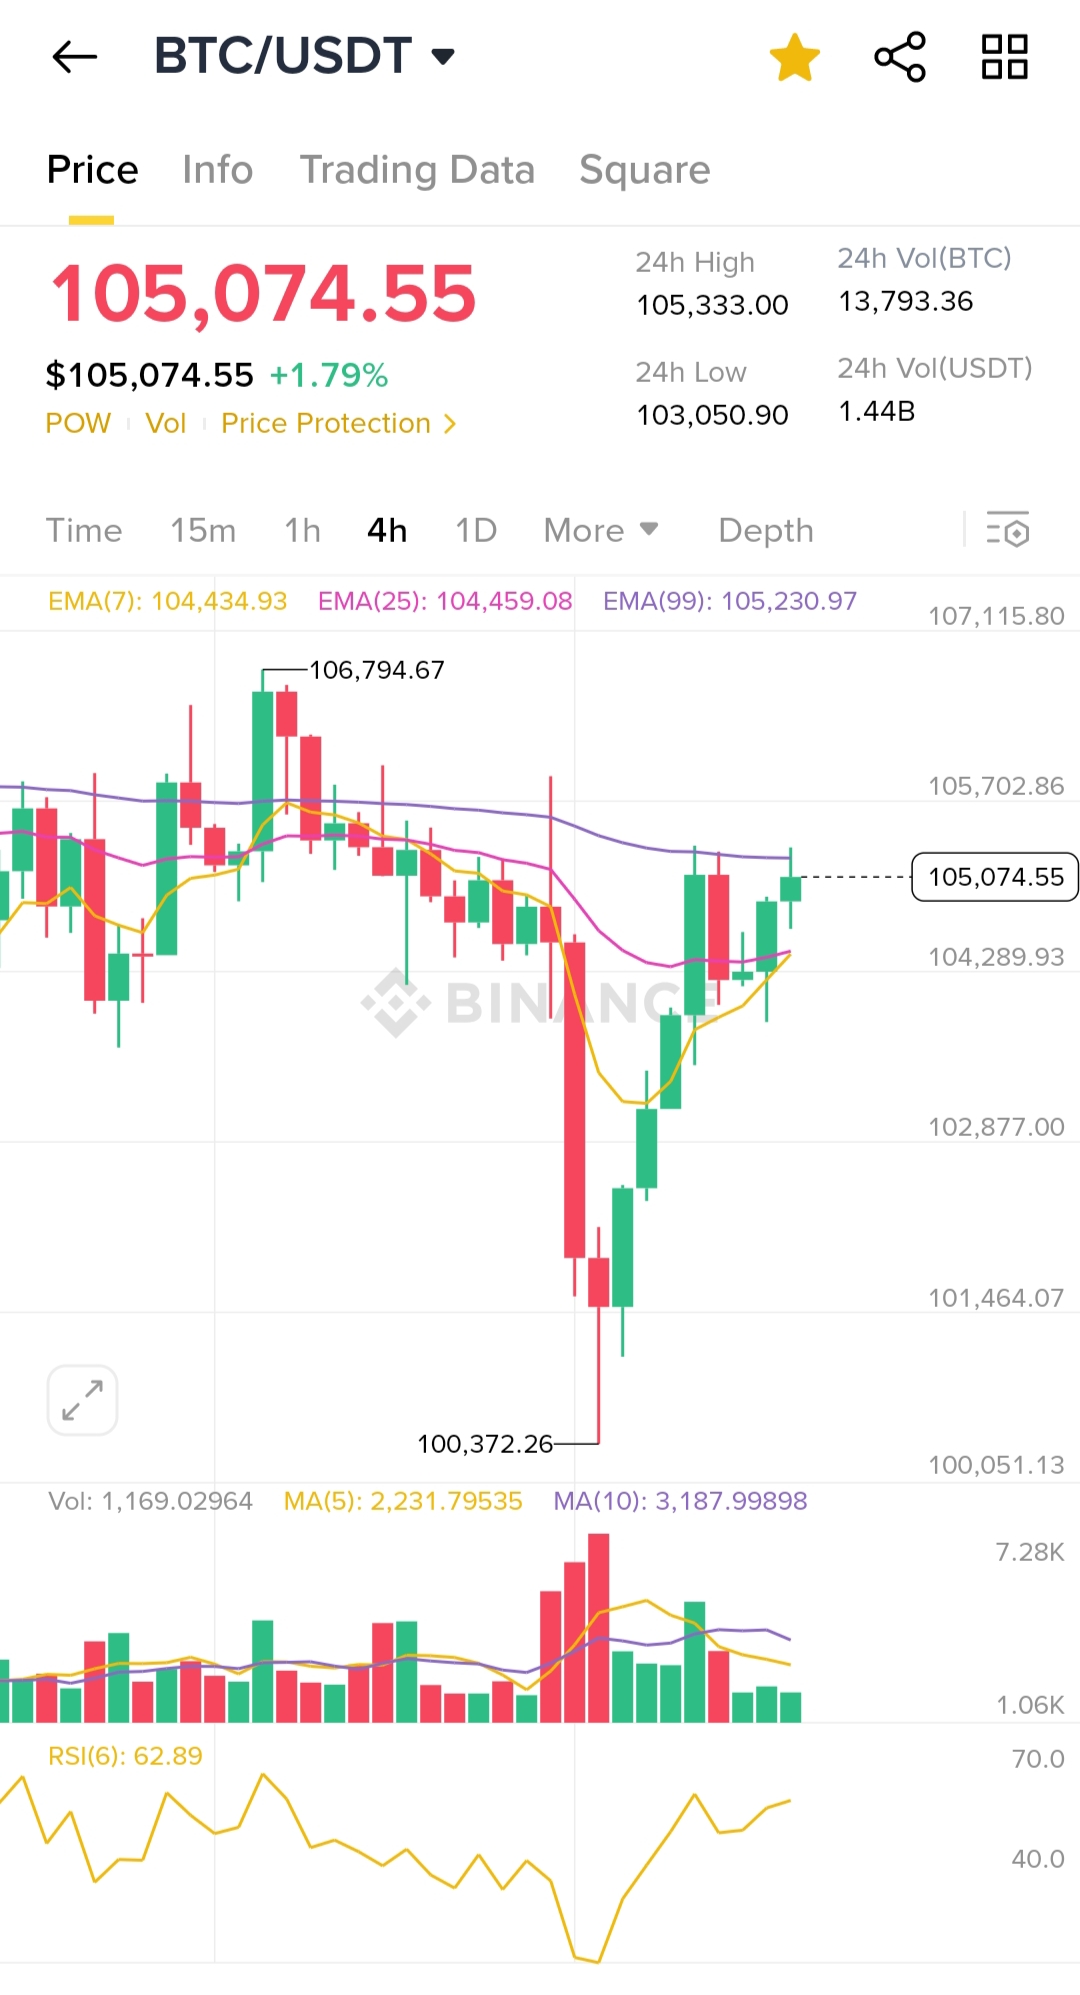
As of: $105,074.55 (+1.79%)
1. Trend Overview
- Price has bounced strongly from the low of $100,372.26.
- Current price is testing the EMA(99) ($105,230.97) as resistance.
- Candle bodies are pushing above EMA(7) and EMA(25), showing short-term bullish momentum.
2. Key EMAs
- EMA(7): $104,434.93 → Turning upward, supports short-term bullish trend.
- EMA(25): $104,459.08 → Crossed above recently, bullish signal.
- EMA(99): $105,230.97 → Acting as immediate resistance.
3. Volume & Momentum
- Volume peaked on the recent bounce; now slightly declining, suggesting cautious buying.
- RSI(6): 62.89 → Momentum is strong but not overbought; room for further upside before hitting exhaustion.
4. Key Levels
- Immediate Resistance: $105,230.97 (EMA99), then $105,702.86.
- Support: $104,289.93 (recent minor low), and major at $100,372.26.
- Volume MA(5): Lower than MA(10) → Shows volume compression, possible breakout brewing.
Conclusion :
Bitcoin is staging a recovery and testing critical resistance. A breakout above $105,230 could trigger further gains, but failure to break may result in short-term consolidations.
You received an upvote of 46% from Precious the Silver Mermaid!
Please remember to contribute great content to the #SilverGoldStackers tag to create another Precious Gem.