Technical Analysis of BTC/USDT
Current Price Action
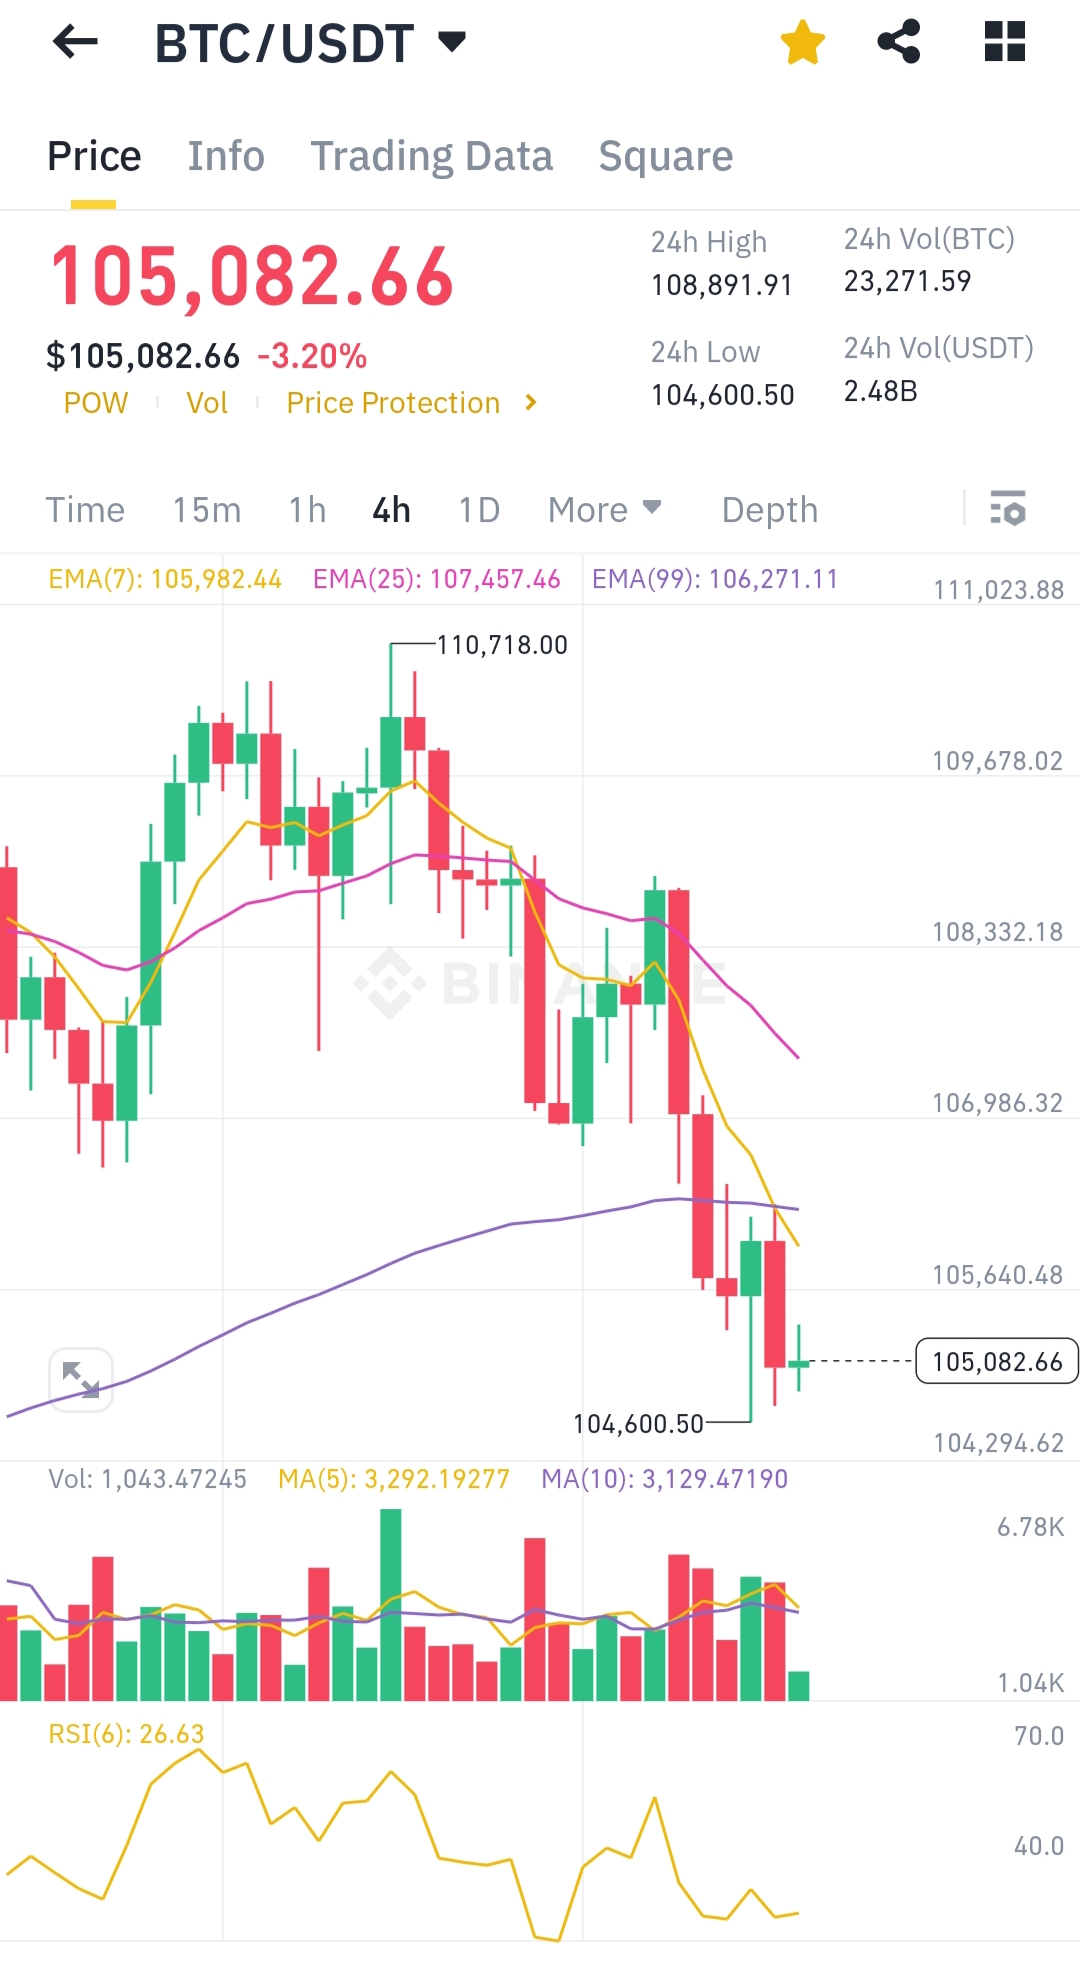
- Price: $105,082.66 (down 3.20% in 24h).
- 24h Range: $104,600.50 (low) to $108,891.91 (high).
- Key Support: $104,600 (24h low), then $104,294 (next level).
- Key Resistance: $105,640 (immediate), then $106,986–$107,457 (EMA barriers).
Trend Indicators
Exponential Moving Averages (EMAs):
- EMA(7): 105,982.44 (price below → short-term bearish).
- EMA(25): 107,457.46 (price well below → medium-term downtrend).
- EMA(99): 106,271.11 (price below → long-term bearish pressure).
- All EMAs are above price, confirming a downward trend.
Relative Strength Index (RSI):
- RSI(6): 26.63 (deeply oversold).
- Historically, RSI < 30 signals potential reversal or bounce.
Volume & Momentum
- 24h Volume: 23,271 BTC ($2.48B USDT), showing high selling activity.
- Volume MA:
- MA(5): 3,292 BTC (current volume below average → weak momentum).
- MA(10): 3,129 BTC (similar divergence).
- Declining volume + oversold RSI hints at exhausted selling pressure.
Key Observations
- Bearish Dominance:
- Price below all EMAs + 3.2% daily drop → sellers control the market.
- Oversold Signal:
- RSI(6) at 26.63 suggests a short-term bounce is likely if support holds.
- Critical Support:
- $104,600 (24h low) is make-or-break. A break below targets $104,294.
- Recovery Case:
- A rebound must reclaim $105,640 (near-term resistance) to challenge EMA(7) at $105,982.
Conclusion
Short-term bounce likely due to oversold RSI, but overall trend remains bearish. Hold support at $104,600 or risk deeper drop.