📉 Technical Analysis – BTC/USDT (4H Chart)
1. Current Price & Trend
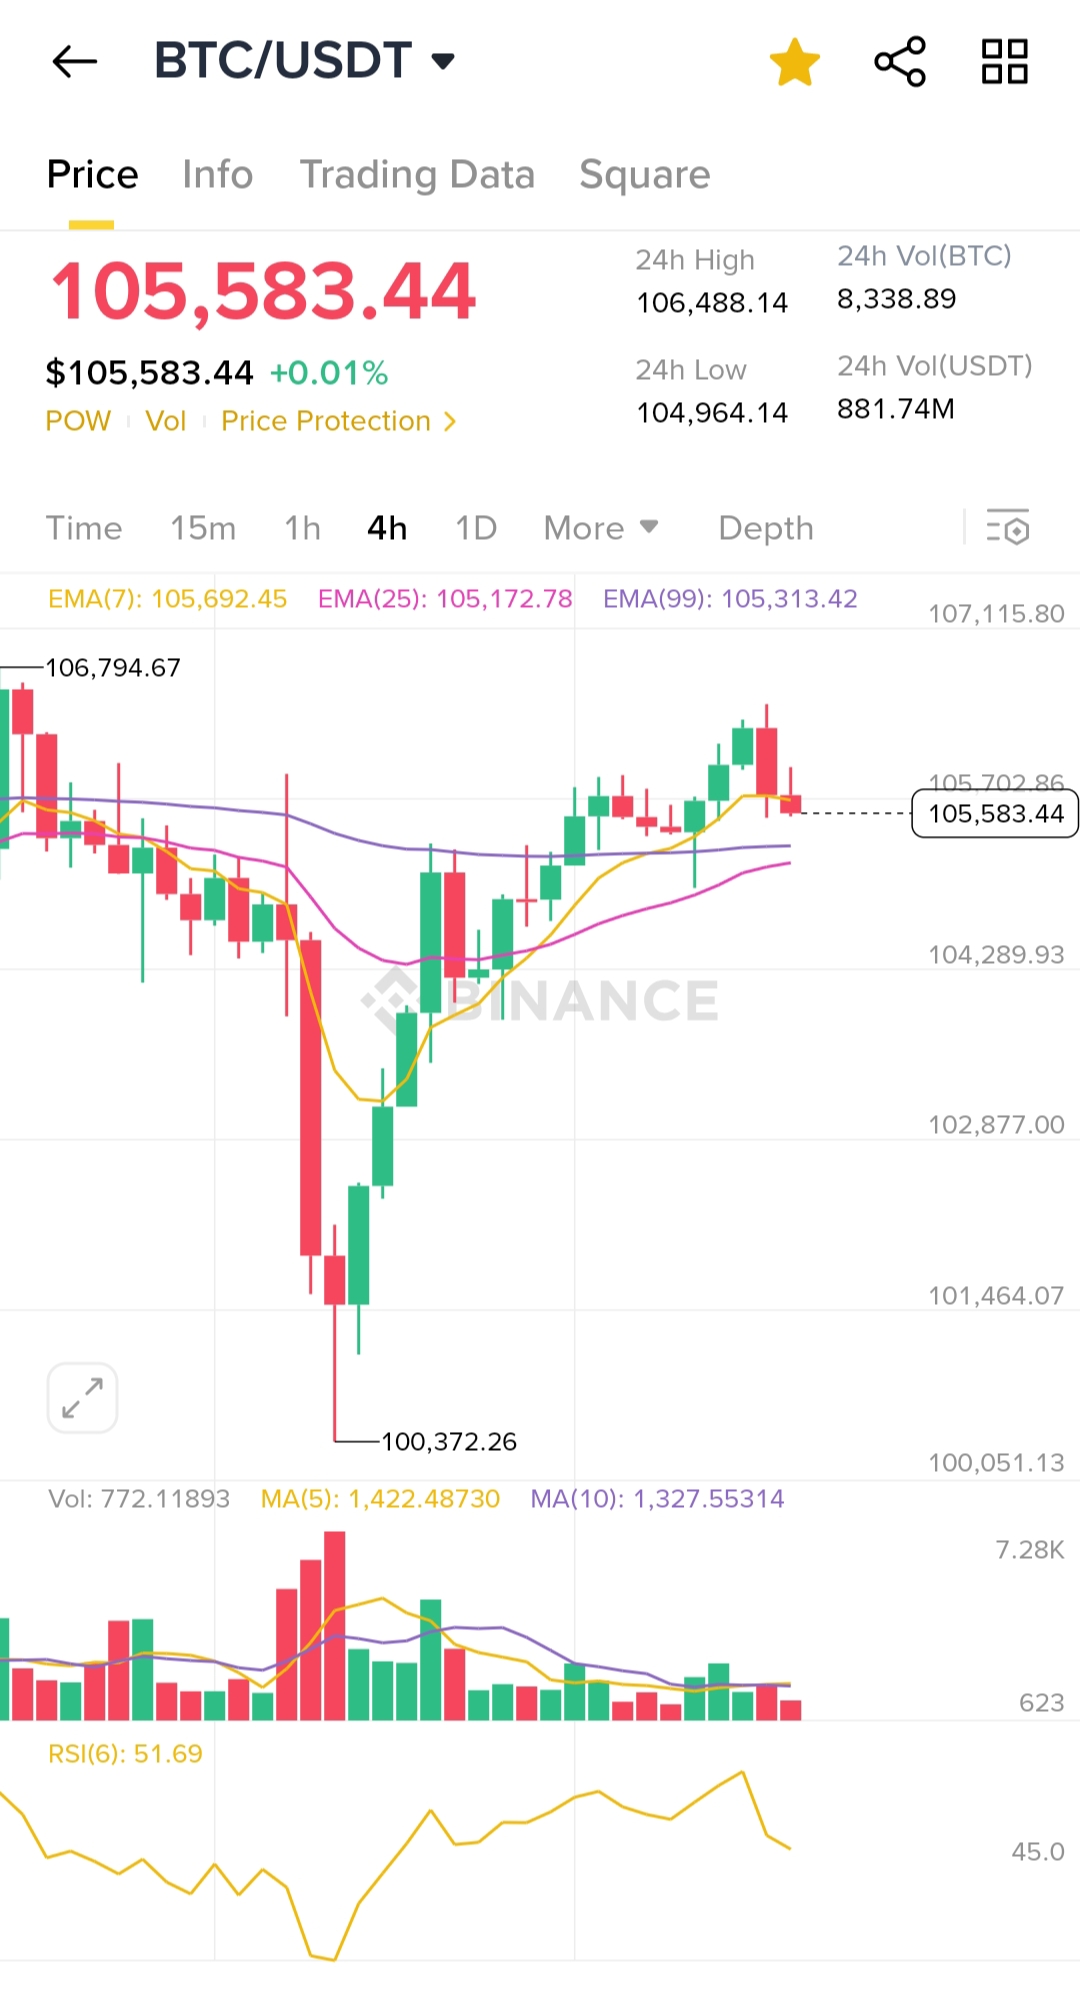
- Current price: $105,583.44
- Price is showing signs of cooling off after a strong recovery from the recent low of $100,372.26.
- A short-term uptrend remains intact, but momentum is fading.
2. Key Support & Resistance Levels
Immediate Resistance:
- $106,794.67 – recent swing high
- $107,115.80 – historical resistance zone
Immediate Support:
- $105,172.78 – EMA(25)
- $104,289.93 – horizontal support
- $102,877.00 / $100,372.26 – deeper support levels if breakdown continues
3. Moving Averages (EMA)
- EMA(7): $105,692.45 (just above current price – acting as dynamic resistance now)
- EMA(25): $105,172.78 (near-term support)
- EMA(99): $105,313.42 (mid-term trend baseline)
- Order: EMA(7) > EMA(25) > EMA(99) → short-term uptrend structure remains
⚠️ Price falling below EMA(7) hints at weakening short-term bullish momentum.
4. Volume & Momentum
- Volume: Gradually declining → suggests buying interest is drying up.
- RSI(6): 51.69 → neutral zone; pointing downward = cooling trend.
- MA(5) vs MA(10) on volume: Bearish crossover indicates softening demand.
Summary
Bitcoin is showing early signs of weakness near resistance and is now testing EMA support. If it holds above $105k, bulls still have a chance. But a drop below $105k may lead to a deeper pullback toward $104k–102k.
You received an upvote of 21% from Precious the Silver Mermaid!
Please remember to contribute great content to the #SilverGoldStackers tag to create another Precious Gem.