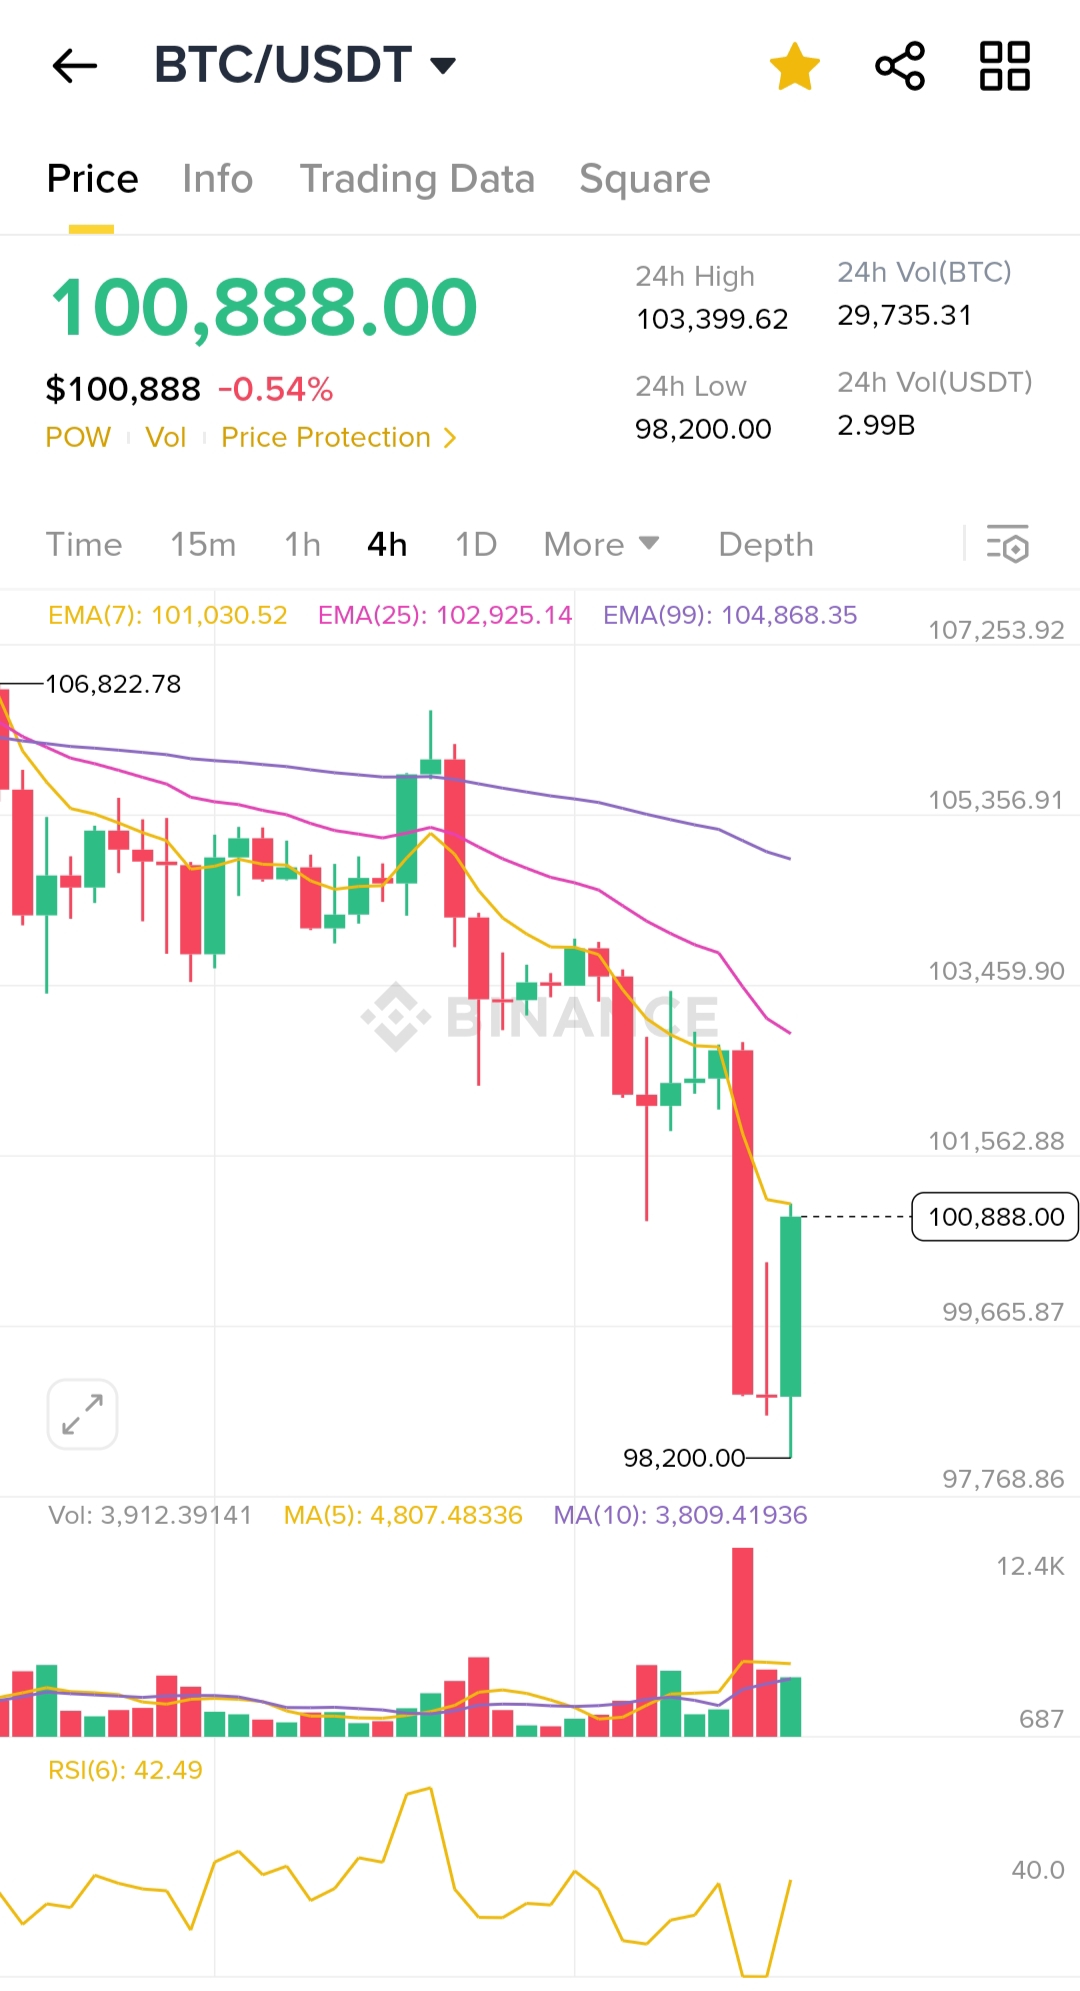
Technical Analysis (4H Chart):
Current Price: $100,888
Recent Low: $98,200 (24H low, marked strong support)
EMA Levels:
- EMA(7): $101,030 – Price currently under short-term trend.
- EMA(25): $102,925
- EMA(99): $104,868 – Clearly bearish as price is trading well below all EMAs.
Price Action:
- A sharp drop occurred after an extended downtrend, hitting $98,200 before a fast rebound.
- Current green candle shows a relief bounce but hasn’t reclaimed the 7-EMA yet, indicating the recovery is still fragile.
Volume:
- Spike in selling volume during the drop suggests panic-driven sell-off.
- Follow-up green volume bar indicates some buying interest (possibly bargain hunting).
RSI(6):
- 42.49 – Weak but recovering from oversold conditions. No clear bullish divergence yet.
Key Resistance Levels:
- $101,562 (minor), then $103,459 and $105,356 (EMA zones).
Key Support:
- $98,200 is a strong short-term support. If broken again, next support could be around $96,000.
Geopolitical Impact:
The sharp price drop aligns with news of a U.S. airstrike on an Iranian nuclear facility. Such geopolitical shocks typically drive risk-off sentiment in markets. Bitcoin, while sometimes viewed as a safe haven, often reacts with volatility during sudden escalations. The initial panic sell-off suggests short-term traders rushed to safety, but the fast recovery hints at long-term holders buying the dip.
Conclusion:
BTC dropped sharply due to geopolitical panic, found strong support at $98,200, but needs to reclaim short-term EMA levels to confirm recovery. Caution advised until it stabilizes above $102K.
You received an upvote of 29% from Precious the Silver Mermaid!
Please remember to contribute great content to the #SilverGoldStackers tag to create another Precious Gem.