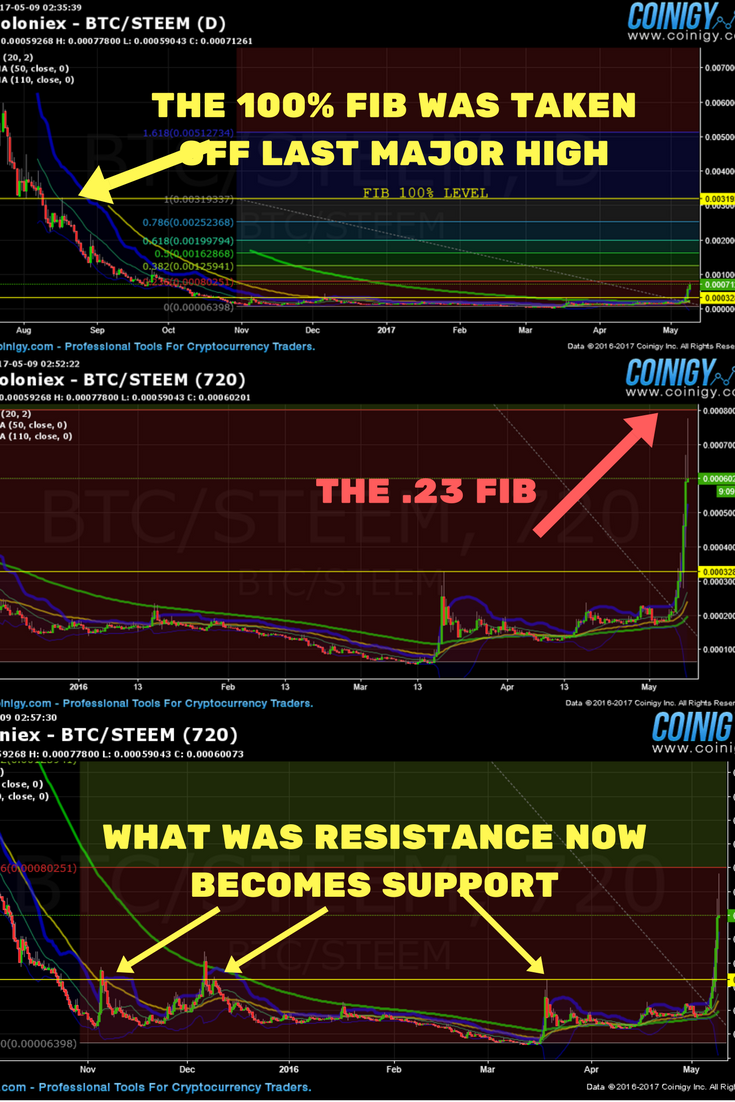
This is a basic out look on what $STEEM price is doing at the moment

The top picture shows where I have taken the 100 % FIB form it is off a day chart.
Second picture is showing $STEEM price getting closer to the .23 FIB Intel this is broken this is still in a down trend but if it does brake could be become a bull market and it's off a 12 hour chart.
third picture shows (Yellow arrows) previous resistances levels so now support levels.
I know this is a super basic look at what i think is happening the market will be doing more indefth trade setups on my blog check it out http://bit.ly/BTCSetups
The charts where made off the coin.igy platform they have great service check them out if anyone is interested
http://bit.ly/coinigytrading
Congratulations @bitcoinsallday! You have received a personal award!
Click on the badge to view your own Board of Honnor on SteemitBoard.
For more information about this award, click here