Today I'm writing about what sorts of things the multivariate normality test can reveal. I've decided to do this activity after recently helping my sister finish her thesis. Due to the fact that her research picked up two dependent variables, the data has to be analyzed using the multivariate variety. As we know from a multitud of statistical books, multivariate analysis requires the testing of assumptions.
The first assumption that we will test using multivariate normality is the following hypothesis:
Ho: This data comes from a population that uses multivariate normal distribution.
Ha: This data is from non-distributed multivariate normal populations.
The multivariate normality test is done by making a scatter plot between the mahalanobis distance and it's chi square distribution. If these plots form a straight line, and more than 50% of the value of the mahalanobis distance is less than or equal to the chi square, then Ho is accepted. This means that the data is using multivariate normal distribution.
How does one perform the multivariate normality test with SPSS?
The multivariate normality test with SPSS is done by determining the distance of the mahalanobis from the available data. We then have to calculate the chi square value. After that we make a scatter plot between the two. This assumes that we have calculated the correlation between the two pieces of data correctly.
Multivariate normality test with SPSS step by step instructions.
First, prepare the data from which we will test the distribution of multivariate normality. To facilitate this exercise, please download the following data. Open the data with the SPSS program. We will conduct a multivariate normality test on achievement and motivation improvement data from 22 students.
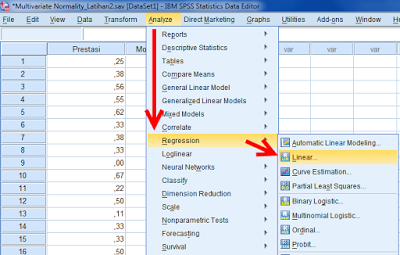
After the data is open in the SPSS program, click Analyze from the menu. Then choose Regression, and then Linear. We do this step in order to determine the distance from the data we have for the mahalanobis.
In the dialog box that appears fill in the Achievement and Motivation variables in the Independent(s) column. Then, enter the variable amount in the Dependent column. Next, it is advisable to click Save.
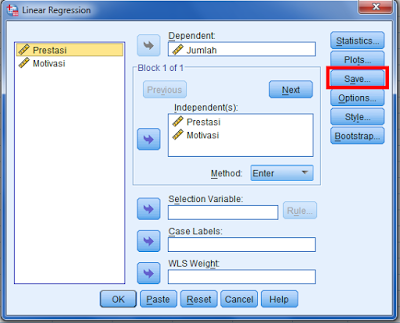
If you have followed the steps correctly then the following dialog box will appear:
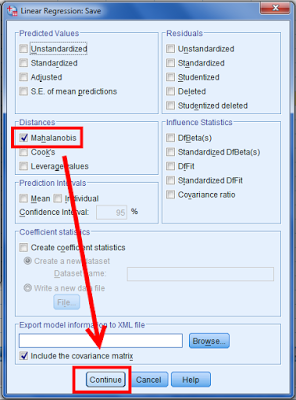
Click Mahalanobis in the Distance tab, then click Continue. If your information is correct, a new variable called MAH_1 will appear in your data. This is the distance of the mahalanobis using the available data.
You have now succeeded in determining the distance of the mahalanobis from the available data. The next tutorial will discuss the method for calculating the value of the chi square. This will then be compared with the distance of the mahalanobis.
This has been my tutorial on the multivariate normality test with SPSS. Please write feedback or criticism in the comment field so that I might have the opportunity to improve this article.
This post has been edited by @jeezzle, a member of the @steemiteditors team.
If You Follow Upvote comment And Resteem me I Will Do Same