El objetivo de este post es que conozcas, interpretes y determines los intervalos de crecimiento y decrecimiento de una función diferenciable en un intervalo dado.
The objective of this post is for you to know, interpret and determine the intervals of growth and decay of a differentiable function on a given interval.
Definición previa / Previous definition
Una función F(𝑥) es creciente en un punto 𝑥0, si para todo 𝑥>𝑥0 se tiene que F(𝑥) > F(𝑥0)
A function F(𝑥) is increasing at a point 𝑥0 , if for all 𝑥>𝑥0 t is held that F(𝑥) > F(𝑥0)
Tomemos como ejemplo la Parábola Cúbica// Let's take the Cubic Parabola as an example.
Recordemos que esta función se define algebraicamente así: // Recall that this function is defined algebraically as follows:
F(𝑥)= 𝑥3
Elaboremos una tabla de valores://Let's draw up a table of values:
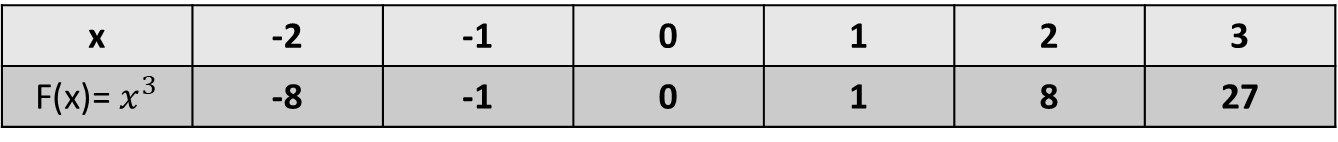
En la tabla observamos que para cualquier par de valores 𝑥 y 𝑥0 que tomemos, tales que 𝑥>𝑥0 se cumple que F(𝑥) > F(𝑥0)
The table shows that for any pair of values of 𝑥 y 𝑥0 we take, such that 𝑥>𝑥0 it follows that F(𝑥) > F(𝑥0).
Por ejemplo, 𝑥 =-1 y 𝑥0 =-2 cumplen esta relación, es decir -1 >−2 y también se tiene que F(-1)>F(-2), esto es: -1 >−8
For example, 𝑥 =-1 y 𝑥0 =-2 fulfill this relation, i.e. -1 >-2 and it also holds that F(-1)>F(-2), that is: -1 >-8
En la tabla observamos que a medida que crece la 𝑥 también crece la y=F(𝑥), este aspecto es lo que define a una función creciente.
In the table we observe that as 𝑥 grows so does y=F(𝑥), this aspect is what defines an increasing function.
He aquí la gráfica de nuestra Parábola Cúbica elaborada con la ayuda de la calculadora gráfica Desmos.// Here is the graph of our Cubic Parabola made with the help of the Desmos graphing calculator.
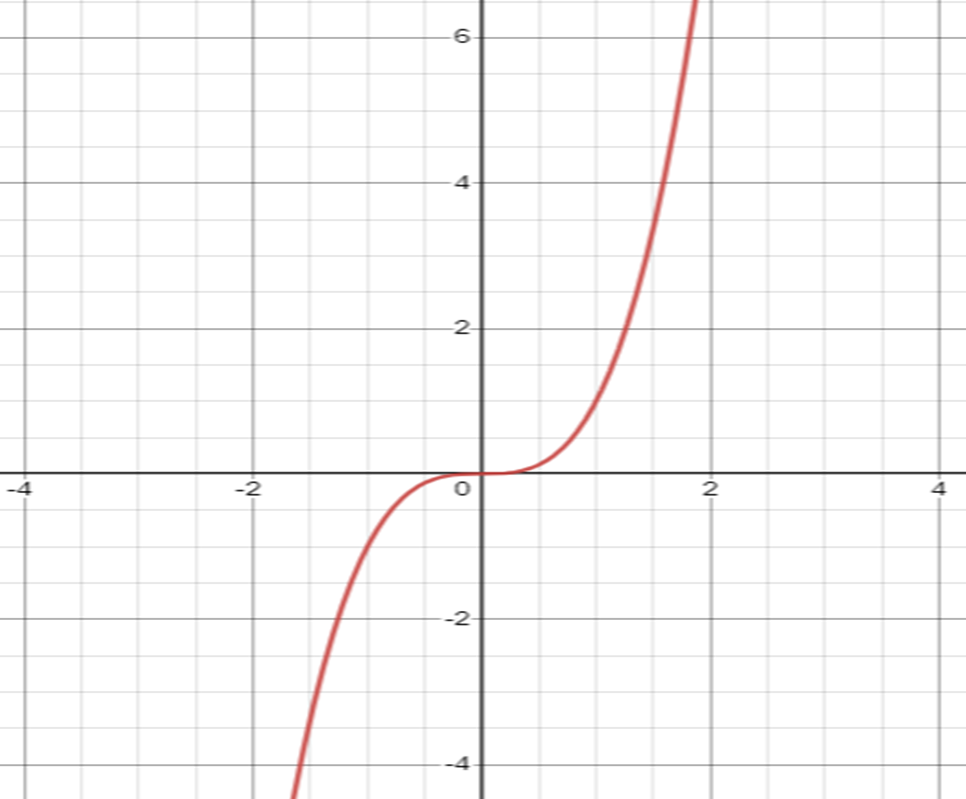
Pero, ¿qué relación existe entre la derivada y el crecimiento de una función?//But what is the relationship between the derivative and the growth of a function?
Veamos//See
Derivando esta función nos resulta F’(x)=3𝑥2, claramente este resultado indica que la derivada de esta función siempre es positiva para todo valor 𝑥 en su dominio, y en tal sentido nos acercamos a algo muy importante.
this function we get F'(x)=3𝑥2, clearly this result indicates that the derivative of this function is always positive for every value 𝑥 in its domain, and in such sense we approach something very important.
Continuemos, entonces // Let us continue, then
El objetivo es establecer el criterio que permita vincular el crecimiento o decrecimiento de una función F con el signo de su primera derivada, es decir F’(𝑥).
objective is to establish the criterion that allows linking the growth or decay of a function F with the sign of its first derivative, i.e. F'(𝑥).
Escojamos un valor 𝑥 cualquiera en el dominio de F, por ejemplo 𝑥 =1, y evaluemos la derivada de F en ese punto://Let us choose any value 𝑥 in the domain of F, for example 𝑥 =1, and evaluate the derivative of F at that point:

Luego la pendiente de la recta tangente al gráfico de F, en el punto 𝑥=1 es 3, es decir que F’(1)=3, este resultado indica que esta recta es creciente, ya que la pendiente es positiva. // Then the slope of the tangent line tangent to the graph of F, at the point 𝑥=1 is 3, i.e. F'(1)=3, this result indicates that this line is increasing, since the slope is positive.
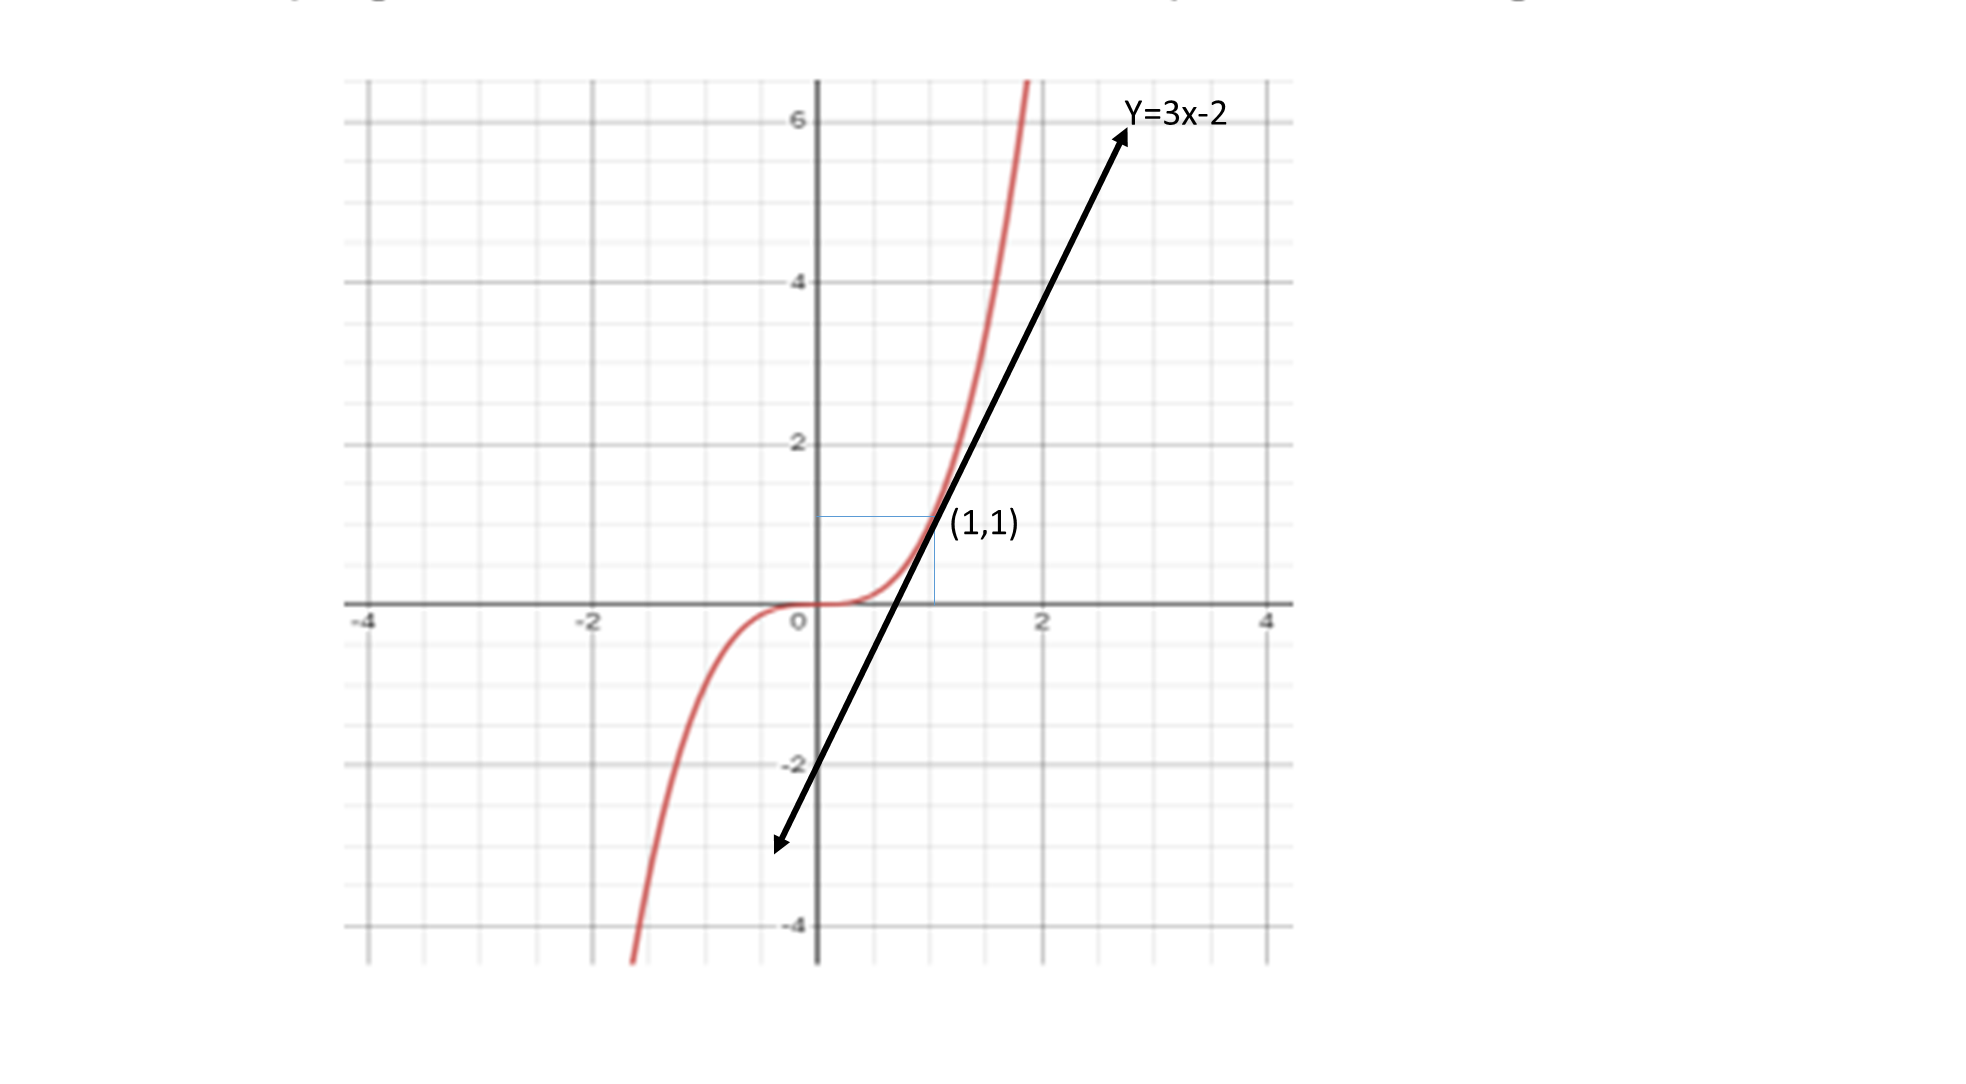
Tracemos la recta tangente al gráfico de esa función en el punto donde 𝑥=1// Let us draw the tangent line to the graph of that function at the point where 𝑥=1.
Sabemos que la recta tangente al gráfico de F pasa por el punto (1,1) y que tiene pendiente 3. // We know that the tangent line to the graph of F passes through the point (1,1) and has slope 3.
Por lo tanto, su ecuación es y= 3𝑥+b // Therefore, its equation is y= 3𝑥+b
Busquemos el valor de b, sustituyendo las coordenadas de este punto y el valor de la pendiente en la ecuación Y= m𝑥+b. // Let us find the value of b, substituting the coordinates of this point and the value of the slope in the equation Y= m𝑥+b.
Esto es: // This is:
1=3.1+b, de donde b=1-3=-2 // 1=3.1+b, where b=1-3=-2
En consecuencia, la ecuación de la recta tangente al gráfico de F en x=1 es: //Consequently, the equation of the tangent line to the graph of F at x=1 is:
Y=3𝑥-2
Analicemos la función opuesta a la Parábola Cúbica F(𝑥)= -𝑥3 , y elaboremos una tabla de valores: // Let us analyze the function opposite to the Cubic Parabola F(𝑥)= -𝑥3 , and produce a table of values:

La gráfica de esta función es el reflejo de la Parábola Cúbica en relación con el eje de las ordenadas Y. // The graph of this function is the reflection of the cubic parabola in relation to the y-axis.
Con el apoyo de Desmos, aquí está el gráfico: // With the support of Desmos, here is the graphic:
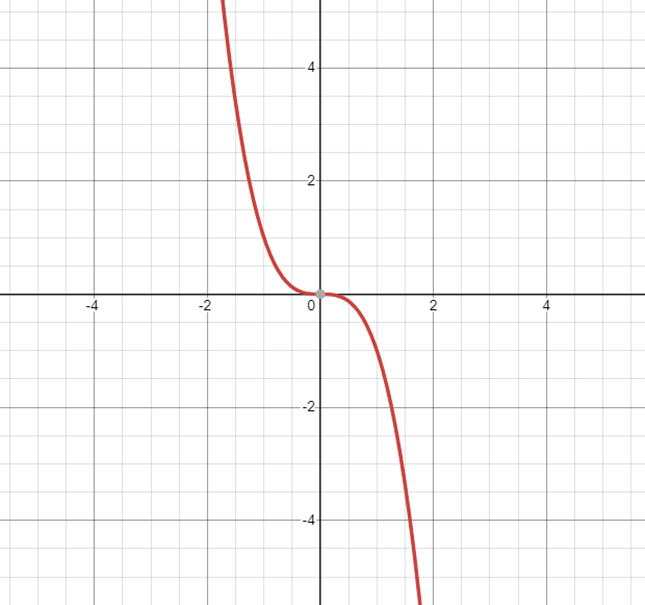
La gráfica muestra una función decreciente en todo su dominio. // The graph shows a decreasing function over its entire domain.
En la tabla se observa que a medida que 𝑥 crece, y decrece, es decir, esta función es decreciente. //The table shows that as 𝑥 grows, and decreases, i.e., this function is decreasing.
Definición // Definition
Una función F(𝑥) es decreciente en un punto 𝑥0, si para todo 𝑥 > 𝑥0 se tiene que F(𝑥0) > F(𝑥)
A function F(𝑥) is decreasing at a point 𝑥0, if for all 𝑥 > 𝑥0 it follows that F(𝑥0) > F(𝑥)
Pero, como lo que se quiere es esclarecer la vinculación entre el crecimiento o decrecimiento de una función con su derivada, y como ya verificó en el caso de la Parábola Cúbica donde la derivada era positiva, veamos que pasa con la derivada de su opuesta F(x)=−𝑥3
But, since what we want is to clarify the link between the growth or decrease of a function with its derivative, and as already verified in the case of the Cubic Parabola where the derivative was positive, let us see what happens with the derivative of its opposite F(x)=-𝑥3.
En este caso F´(𝑥)= -3𝑥2, la cual siempre va a ser negativa para cualquier valor x en el dominio de F(x). ¿Por qué? // In this case F'(𝑥)= -3𝑥2, which is always going to be negative for any x-value in the domain of F(x). why?
Escojamos un valor 𝑥 cualquiera en el dominio de F, por ejemplo 𝑥=1, y evaluemos la derivada de F en ese punto: // Let us choose any value 𝑥 in the domain of F, for example 𝑥=1, and evaluate the derivative of F at that point:

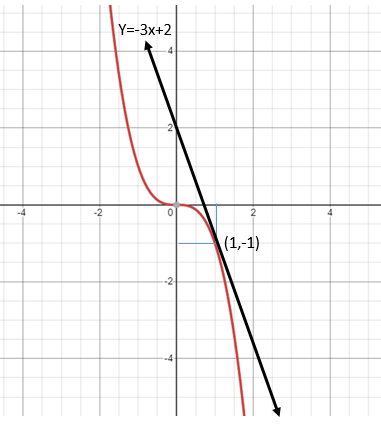
Luego la pendiente de la recta tangente al gráfico de F, en el punto 𝑥=1 es -3, es decir que F’(1)=-3, este resultado indica que esta recta es decreciente, y lo va a ser siempre en cualquier punto del gráfico de esta función.
the slope of the tangent line tangent to the graph of F, at the point 𝑥=1 is -3, i.e. F'(1)=-3, this result indicates that this line is decreasing, and it will always be decreasing at any point of the graph of this function.
Tracemos la recta tangente al gráfico de la función en el punto donde 𝑥=1. // Let us draw the tangent line to the graph of the function at the point where 𝑥=1.
Sabemos que la recta tangente al gráfico de F pasa por el punto (1,-1) y que tiene pendiente -3. // We know that the tangent line to the graph of F passes through the point (1,-1) and has slope -3.
Por lo tanto, su ecuación es y= -3𝑥+b // Therefore, its equation is y= -3𝑥+b
Busquemos el valor de b, sustituyendo las coordenadas de este punto y el valor de la pendiente en la ecuación Y=m𝑥+b. // Let us find the value of b by substituting the coordinates of this point and the value of the slope in the equation Y=m𝑥+b.
Esto es: // This is:
-1=-3.1+b, de donde b=-1+3=2 // -1=-3.1+b, where b=-1+3=2
Por lo tanto, la ecuación de la recta tangente al gráfico de F en 𝑥=1 es: // Therefore, the equation of the tangent line tangent to the graph of F at 𝑥=1 is:
Y=-3𝑥+2
Vamos a generalizar los resultados anteriores utilizando la siguiente función: // We will generalize the above results using the following function:
G(𝑥)=𝑥4-2𝑥3-3𝑥2+4𝑥+4
Cuya derivada es la siguiente: // Whose derivative is as follows:
G'(𝑥)=4𝑥3-6𝑥2-6𝑥+4
Aquí tenemos la gráfica con la ayuda de la calculadora gráfica Desmos. // Here is the graph with the help of the Desmos graphing calculator
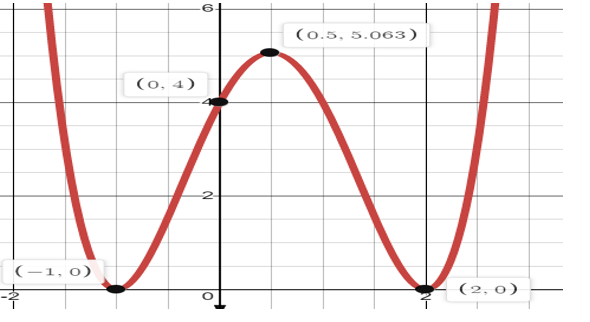
Identificamos los siguientes intervalos: // We identify the following intervals:

Tomemos un valor para 𝑥 en el interior de cada uno de los intervalos y evaluemos la derivada. // Let us take a value for 𝑥 in the interior of each of the intervals and evaluate the derivative

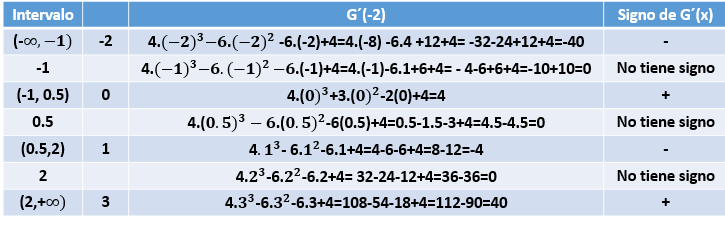
En el cuadro anterior, el signo de la derivada de G nos indica la pendiente de la recta tangente al gráfico de G en cualquier punto del intervalo considerado, es decir que: // In the previous table, the sign of the derivative of G indicates the slope of the tangent line to the graph of G at any point of the considered interval, that is to say that:
En el Intervalo (−∞, −1) la recta tangente es decreciente, por lo tanto, G es una función decreciente en ese intervalo. // In the Interval (−∞, −1) the tangent line is decreasing, therefore, G is a decreasing function in that interval.
En el punto x=-1, la pendiente de la recta tangente es 0, en consecuencia, la tangente es horizontal y G no es creciente ni decreciente. // At the point x=-1, the slope of the tangent line is 0, consequently, the tangent is horizontal and G is neither increasing nor decreasing.
En el intervalo (-1,0.5) la pendiente de la recta tangente es positiva, esto quiere decir que G, en este intervalo, es creciente. // In the interval (-1,0.5) the slope of the tangent line is positive, this means that G, in this interval, is increasing.
En x=0.5 la tangente es Horizontal, G no crece ni decrece. // At x=0.5 the tangent is Horizontal, G does not increase or decrease.
De acuerdo al cuadro, G es decreciente en (0.5,2). // According to the table, G is decreasing in (0.5,2).
Y finalmente, creciente en (2, +∞). // And finally, increasing in (2, +∞).
La recta tangente al gráfico de G en x=2, también es horizontal. // The tangent line to the graph of G at x=2 is also horizontal.
Para concluir: // In conclusion:
Diremos que: // We will say that:
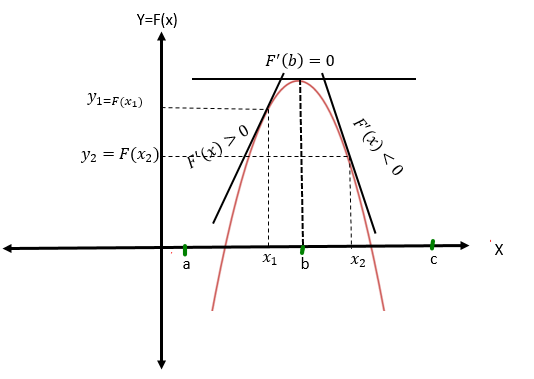
Si F'(x1)>0 para todo x1 en el intervalo (a,b) entonces F es creciente en [ab]
Si F'(x2)<0 para todo x2 en el intervalo (b,c) entonces F es decreciente en [b,c]
Si F'(b)=0 para algún b en el intervalo (a,c) entonces la tangente es horizontal en ese punto.
If F'(x1)>0 for all x1 in the interval (a,b) then F is increasing on [ab]
If F'(x2)<0 for all x2 in the interval (b,c) then F is decreasing on [b,c]
If F'(b)=0 for some b in the interval (a,c) then the tangent is horizontal at that point.
Dejamos este ejercicio para que lo resuelva el lector: // We leave this exercise for the reader to solve:
Hallar los intervalos de crecimiento y decrecimiento de la siguiente función en el intervalo [1,9], hacer un bosquejo de la misma. // Find the intervals of increase and decrease of the following function in the interval [1,9], make a sketch of it.

Créditos // credits
Este post es original de la autora.
Las gráficas se hicieron con la ayuda de la Calculadora gráfica Desmos.
Se usó PowerPoint para el diseño de las imágenes, y las ecuaciones con el editor de ecuaciones.
This post is original from the author.
The graphs were made with the help of the Desmos Graphing Calculator.
PowerPoint was used for the design of the images, and the equations with the equation editor.
¡Felicitaciones!
Estás participando para optar a la mención especial que se efectuará el domingo 7 de mayo del 2023 a las 8:00 pm (hora de Venezuela), gracias a la cual el autor del artículo seleccionado recibirá la cantidad de 1 HIVE transferida a su cuenta.
¡También has recibido 1 ENTROKEN! El token del PROYECTO ENTROPÍA impulsado por la plataforma Steem-Engine.
1. Invierte en el PROYECTO ENTROPÍA y recibe ganancias semanalmente. Entra aquí para más información.
2. Contáctanos en Discord: https://discord.gg/hkCjFeb
3. Suscríbete a nuestra COMUNIDAD y apoya al trail de @Entropia y así podrás ganar recompensas de curación de forma automática. Entra aquí para más información sobre nuestro trail.
4. Visita nuestro canal de Youtube.
Atentamente
El equipo de curación del PROYECTO ENTROPÍA
Muchísimas gracias por vuestro voto.
Thanks for your contribution to the STEMsocial community. Feel free to join us on discord to get to know the rest of us!
Please consider delegating to the @stemsocial account (85% of the curation rewards are returned).
You may also include @stemsocial as a beneficiary of the rewards of this post to get a stronger support.
Muchísimas gracias por vuestro voto.