Everybody is familiar with the six-sided die with values from one to six on its faces, but what would happen if we start mixing it up a bit? If we play with the numbers, we can come up with all kinds of interesting configurations. if we start altering the faces, there will be some variations that are going to be stronger than others and would give us a better chance of winning if we play one on one against a different dice.

The Simplest of Examples
For instance, if we adjust all six sides of a die to show 6, this would beat a regular die or a die that has only fives on each side. This means we can take a pair of dice and determine if one is stronger than the other. While the dice with the same number on all sides are pretty simple, we could have options that are a bit more groovy like the example below.
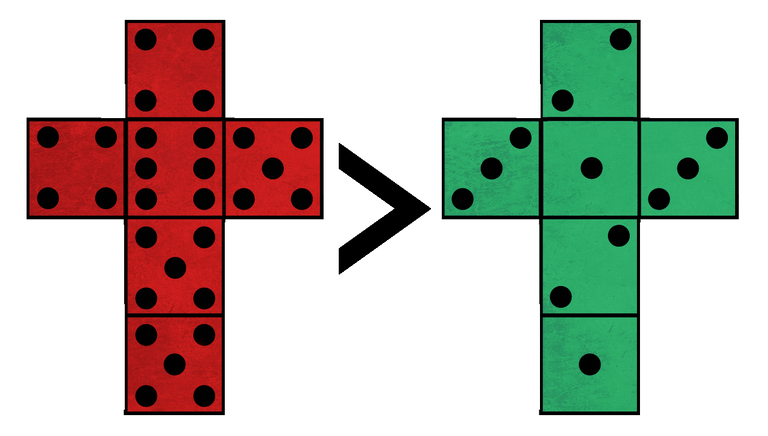
Still, there is a very clear winner. As any number on the red die can beat any number from the green die, we can say that the red die is not only stronger, but also has 100% probability of winning. The red die is going to win every single game against the green one.
But let's look into some cases that are a bit more curios where the probabilities are not so simple and the outcome is not always that straightforward.
The More Interesting Case
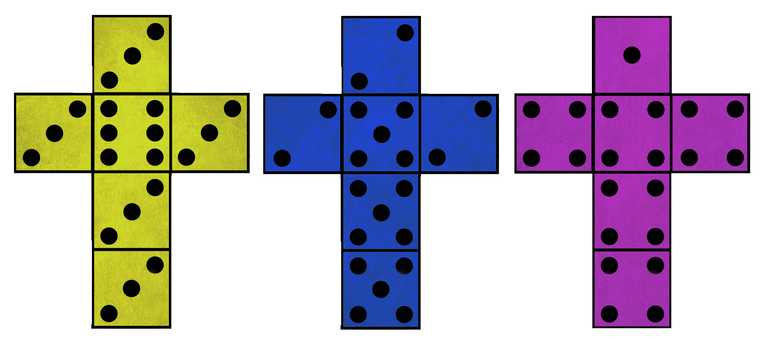
Let's try to determine which of one of the three dice above is the strongest one. Many people's first instinct might be to calculate the average score each die can get you and go from there. But if we try that we'll notice that the sum of the six sides from each of the dice above is 21 giving all of them an average score of 3.5.
Well if this approach doesn't work, let's try to examine pairs and try to see how each die fares against the others.
Yellow vs. Blue
To determine which of the two is stronger, we actually have to examine each outcome's probability. Let's try to do that avoiding complicated math first. The yellow die can roll two different numbers. If it rolls a 3, the blue die has 50% chance of winning because half of its faces are higher while the other half of its faces are lower than 3. So if the yellow die rolls a 3, both dice have an equal chance of winning depending on what the blue die rolls. But if the yellow die rolls a 6, the blue die has no chance of winning and while the yellow die will roll a 6 less often, it still gives it an edge.
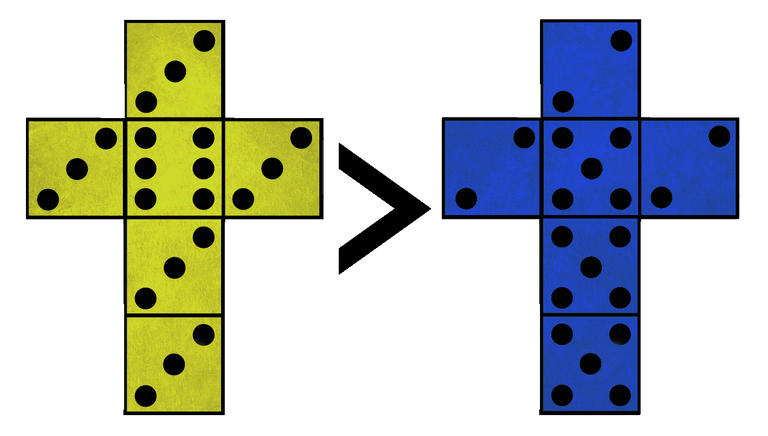
Of course, we can also calculate the exact probabilities. The yellow die will roll a 3 with probability of 5/6 and since the blue die can roll either a 2 or a 5 with a probability of 1/2, either outcome gets a probability of 5/12. The probability of the yellow die rolling a 6 is 1/6 and that's also the probability of it winning in that case. So the total probability of the blue die winning is 5/12 and the total probability of the yellow die winning is 5/12 + 1/6 which is 7/12. This is 58.3%.
Blue vs. Purple
When we compare the blue die and the purple die, we can do very similar analysis. If the purple die rolls 4, it is going to have 50% chance of winning as half of the blue die's faces are higher and the other half are lower. But if the purple die rolls 1, it is going to loose to the blue one no matter what as all of the blue die's faces are higher. The math works out in the exact same way with the probability of the blue die winning being 7/12 while the purple die has to settle with only 5/12.

But does this mean that the yellow die is the strongest and the purple die is the weakest in this selection? Let's check!
Purple vs. Yellow
If you look carefully at the two configurations, it's actually quite easy to see that the purple die is stronger even without doing the math. If the purple die rolls 1 it loses automatically, but the purple die has only one such side. The probability of losing in this case is just 1/6. But if the purple die rolls 4, it faces very good chances as the yellow has only one face that could beat it giving it a chance of 5/6. And since the chance of rolling a 4 is 5/6, too, we multiply the two probabilities to get the total probability of the purple die beating the yellow die which is 25/36. Turns out that the purple die is not only not the weakest but it has a 69.4% chance of beating the yellow one which we thought might be the strongest.
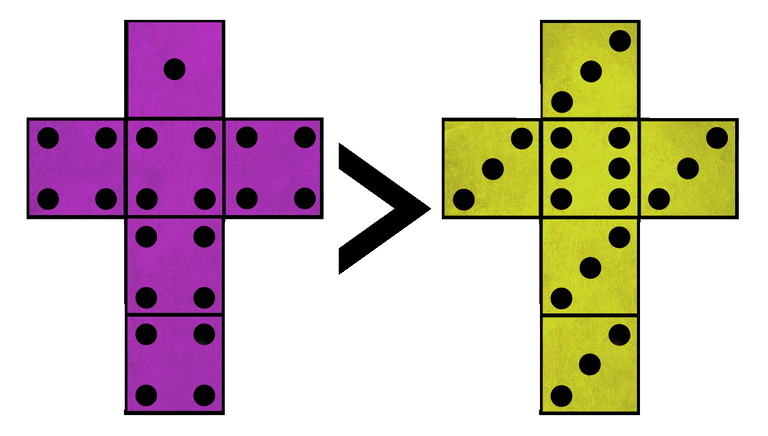
So which die is objectively the strongest from the bunch?

Well, apparently none. In this group of dice there is no die that is the strongest while each pair produces an advantage for one of the dies. If you have those 3 dice and you want to play against a friend, you can always graciously give them the advantage of examining the dice and choosing first. This will make your chances of victory higher because you can always choose a die that will beat their chosen one. Of course, since the probabilities are never 100%, you are not guaranteed to win, especially in a shorter game, but the odds will be significantly tilted in your favor. Remember, casinos make a killing with much smaller advantages.
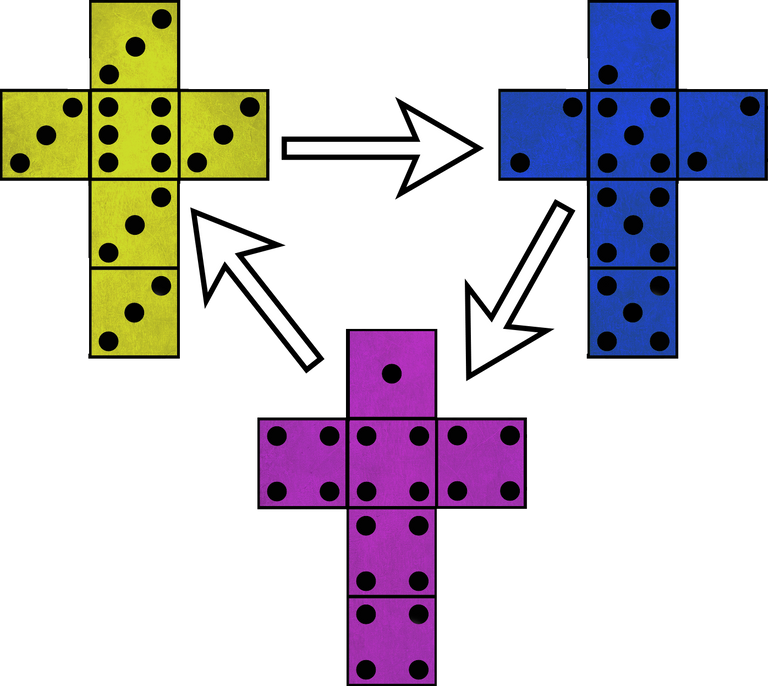
Such groups of dice are called non-transitive dice and their strength works in a circle just like a game of rock/paper/scissors. There are other such combinations of dice that exhibit similar properties where a group of dice doesn't have a clear favorite, but the pairs of likely winners and losers and arranged in a circle.
The Moral of the Story
It's important to know about this effect when dealing with probabilities because our intuition about that could easily mislead us. The fact that A is more probable than B in a head to head comparison and B is more probable than C in another head to head comparison by no means proves that A is more probable than C. It sounds like a very logical conclusion, but it is not a conclusion that one could draw with any level of certainty. In many cases A would in fact be more probable than C, but not always. Sometimes reality is going to go against our intuition and C would actually be more probable than A just like it is with non-transitive dice.
Knowing this is possible is very important when trying to interpret data that comes from more than one source as the different head to head comparisons we might be looking at might still be hiding the full picture from us. Before a conclusion can be drawn with certainty, the relation the we are claiming needs to be tested itself, not just inferred circumstantially from other relations.
I hope you found this interesting and I hope it will be yet another reason for you to always question your intuition, instead of jumping to conclusions. Our innate human intuition did not evolve to calculate probabilities correctly or to deal with large sets of data, so we should try to always check it instead of relying on it.

Sources:
- James Grime 2010 | http://singingbanana.com/dice/article.htm
- https://en.wikipedia.org/wiki/Nontransitive_dice
All images are original unless a specific source is cited.

Very cool example of a situation where assuming the dice strength is transitive is paradoxically incorrect. You explain everything very clearly. Thanks for posting!
Thank you for stopping by and taking the time to read and share your opinion! :) I appreciate it!
So, if I understood what your post said, the probabilities of each die you provide winning when pitted against one other were based on one roll of each competing die.
But if the two dice are rolled more than once against each other, it gives more chances for the die with a favorable 1/6 option to actually hit it, though it also gives the one with the 5/6 option that many more chances of winning.
Also, since I'm not a dice expert, does the probability change at all based on how you hold the die, or how you roll it each time?
In other words, while the probability of winning against another die could be set based on amounts and their availability, the person rolling the die could be adept enough to manipulate the outcomes by figuring out beforehand what starting position and what potential force and angle might result in more favorable odds.
It's not really one roll, I'm examining the probability for each possible roll. The probabilities give you the expected distribution of win in a long series of rolls, not just a single roll. It's just that each face or roll of a certain die has a specific probability to come up and that allows us to calculate the total probability for each outcome. In fact, you could draw a six by six table with the faces of one die for rows and the faces if the other for the columns. The cells of that table would be the possible outcome of the two dice being rolled. Each cell of the table has an equal probability of happening. If you do that table for the yellow vs blue scenario, you are going to get 21 out of the 36 cells which is the same as the 7/12 probability and the blue is going to get 15 out of the 36 cells which is the same as the 5/12 probability.
It's not what the post examines. It examines the odds that the die itself affords you with fair random rolls. I'm just examining the dice themselves. If you have a player with some skill, they would still do better with the yellow dice than with the blue dice. The yellow dice still has the same intrinsic advantage, just the player can get other ones as well. If we are talking about a proper casino situation where the dice need to bounce off of an unevenly shaped backboard, than all claims of skill tend to be scams to get people to pay you for lessons, confirmation bias, or both. But that's a whole other story and it's really beside the point here.
Also keep in mind that casinos are making tons of money with the odds being in their favor with just a few percentage points while those dice afford you significantly higher advantages. So if it's fair to say that casinos are rigged to win, than those dice are even more unbalance and rigged even harder if that makes sense.
if you understand the concept of district gerrymandering, you can see the similarities in play here
in gerrymandering the political party will structure the districts according to known voting patterns in order to gain the most favorable end result. by forcing losses into as few districts as possible and allocating to win in other districts by slim margins they can turn what is an even vote or even a losing vote into a win
in the above case of purple vs yellow you can see where an even dot amount has been "gerrymandered" to achieve an overwhelming advantage. in this analogy yellow has been structured to place a wasteful majority of its votes in one district. purple has spread its influence around as much as it can
when the final reckoning happens, purple comes away with a landslide victory that should not have been possible but for this extremely crooked political practice
That's a great observation! It's absolutely fair to say that those dice have been gerrymandered in a way that one of the dies would have victories by larger margins but of fewer number while the other would have a larger number of victories my a smaller margin. And indeed, those dice examples as well as others like it have been intentionally "gerrymandered" so they can produce this type of results just as political districts where the population is evenly split, but one side ends up with a landslide victory due this extremely crooked political practice indeed!
Great piece, Dave. Understanding this is a great reason to keep some data which appears contradictory on cursory examination.
Thank you, Matt, I honestly appreciate it! That's why I wanted to share this information.
Man, I rarely read articles on steemit that I'd read anyway out of genuine interest. This is one of them. Good job! 👍
That's really great to hear, thank you! :)
Here is the numberphile video about this ->
I'm glad you found this topic interesting and decided to dive into it more. I think the non-transitive dice configuration they are using here is known as Efron's Dice. If you want do dive even deeper, I suggest reading about Grime's Dice and similar games for more than two players. The first link in my sources is a great place to start.
So actually I started the other way round. A few years ago I saw the video of Tokieda-sensei, then I came accross Grimes and then some older work (Martin Gardner). The idea of these dice is not that new. It dates back all the way to 1970. However, some nice variation have been made over time.
The last minute of Tokieda-sensei's video is quite nice since he couples it to probabilistic research work. So I thought it was a nice addition. :)