WEEKLY MARKET REPORT
By Moksh Rajput
Friday September 21, 2018
Quite some moves have occurred in this past week. Let’s take a look…
BBBY, Bed Bath and Beyond has broken out and my official buy was at $19. Today, 09/21/2018 it closed at $19.13. BBBY is a very strong buy in my playbook and the rally can last weeks and give you many %.
Very pleased with CHTR this week. It performed right up to how I had set it up. I entered CHTR at $318 on 09/13/2018. It has risen to $332.59 where it closed today at that price. In last weeks’ market report I stated it will find resistance at $333. I already sold 50% of my position in CHTR for a 4.68% profit; I will hold the rest to the second price target $ 350. I moved my stop up to $311.50. It may correct a little, but my weekly RSI signal is still pointing the price into higher territory.
Last week I said not to enter FB. FB is still and will be playing around the red middle trend line (see monthly chart). It closed today at $162.93; it is taking major support at the bottom red trend line (see monthly chart). I still believe FB will be rising up; just the arrows in the daily chart have been shifted. In a couple of weeks, I will get my short opportunity. Moksh just be patient…
Last week was definitely a good time to take some profits off your shorts. As well, as I said last week GOOG had very good support at $1160 and even had a bullish candle that pulled it up to $1185 at the red trend line (see daily chart). My daily signal might give a buy signal in the upcoming week, but in weekly Google is still a short. Just going to stay out of this one.
TSLA was only a short if it broke the red trend line in the monthly chart. It in fact did not break it, but took it as support and started rebounding up from there. My position on this stock still stays the same, if TSLA can break $250 and the RSI breaks 46.25, then that will be a very nice short. If you see the weekly chart, there are two major areas of resistance for TSLA, first is $300-305 and second is $321-325. Today it closed at $299, just under the first area of resistance. It may start going down from here in the next week, or break it and run all the way to $321. I’ll keep you guys updated.
Quick update on LULU, it had a massive power earnings gap. It may keep going on further. I’ll leave it to you guys. LULU is at a delicate time since my daily RSI is soon going to give me a signal to short it. I don’t want to get trapped for 4-5%, but for the aggressive trader it may be good trade.
This week, NVDA breached $268 where I said I would short it. Today it closed at $263 for a cool 2.74% profit. I sold 25% of my buy and 75% is remaining because I strongly believe it will go to $251. If it breaks that, then I will be shorting it bigly.
TXN broke $106.50 as I wrote last week. And it went down to $102.19, but today it closed at $110.05. In weekly chart, the RSI might take resistance at the red trend line. In monthly terms, TXN is still a short for me. I will be holding it since I believe it will be going to $80 in the upcoming months.
HF, HFF Inc. has not breached $48.82 so I did not buy it. In fact it came down to $44.12 today. If HF can reverse at $43, then that will be an even stronger buy when it breaks $48.82. Although, in monthly chart, HF, may be showing a short sign soon. Just wait and watch.
I have bailed out of VMW. Last week, weekly RSI was showing a buy but now for me it is showing a sell. This is a very difficult time, since VMW took support on the bottom red trend line but in the monthly RSI it is a short. I will be possibly entering in a short next week.
PEP, PepsiCo did face resistance at the 1.5x mark of the horizontal box. I still believe PEP will go up from here where it closed back at the 1.5x at $114.91.
In the past week ACIA did close above $40.5 but did not with a nice strong white body. It is just keep playing around the top part of the upper red trend line (see weekly chart). I will enter once I get close above $42.50.
IBM broke out above $147 last week and I entered. Today I sold 50% of my position at $151.96 for a 3.19% increase, because it may come back to retest the neckline at $106-107.
TBK majorly dumped 6.40%. I got stopped out at $40.61.It may come down the bottom blue line in daily chart and take support there. Long term it will be a short as monthly RS is showing a reversal.
IQ has not burst out of the orange line.
Very nice gains made with BA so far. My buy was at $357 and it closed today at $372.23 with a 4.13% profit. I expect this to go all the way to $400 and face resistance there.
HUYA has not broken out of upper red trend line.
CARA is one of my weeks best winners. It still has quite a way to go and the profits for CARA till now are quite nice to. I purchased it at $21.50 and today it closed at $23.18. This is a nice 8% increase to capital put into CARA. This stock has still quite a long way to go.
Enough of the recap of past week stocks… now for some new findings of this week.
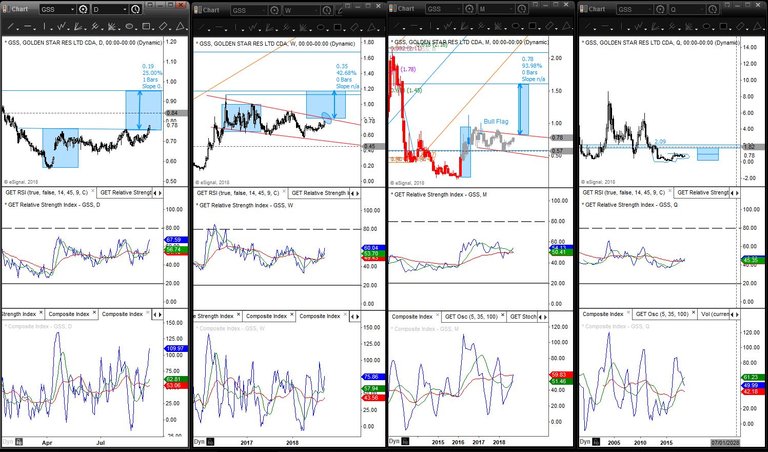
One of my favorite findings of this week is GSS, Golden Star Res LTD CDA. In the daily chart, GSS is already a buy, because of the head and shoulders that has been forming since March of 2018. Just last Friday it closed above the neckline with a nice white body and a 1.93% gain. The target in daily is a healthy 25% what would mean the increase is 0.19$. This is only the short-term target for this stock. What I find very interesting is the beautiful pattern that has occurred for GSS in the monthly and quarterly chart. One step at a time… Let’s talk about Monthly first. In monthly chart, there is a very nice bullish flag that has occurred. The move from 0.18 to 0.93 is the flag pole and the current price action bouncing around within the two red trendlines (see monthly chart) is the flag. So, if we put the height of the flagpole onto of the breakout point that takes us to $1.62, for a 93.98% increase. Now, look at the weekly chart. I took the height of the flag and put it on top of the flag giving me a target of $1.17. But, if you look right under the target there is a line from the recent high GSS made; the stock can stop there since sellers may come back there and since the previous high and target are so close. Now we can talk about Quarterly. In the quarterly chart, GSS is forming such a nice rounding bottom which has now turned into a cup and handle. This C&H bottom can take GSS all the way to $1.70! Overall, all my RSI signals are showing a major trend reversal and a nice bullish feature. I believe that this rally is going to last for months and quarters. This stock has just bottomed out. Now for the recap, GSS will first be reaching the daily target, then the weekly target, then monthly target, and finally the quarterly target. Possibly after reaching each target they will take time to consolidate, which would be nice, so it can be a healthy increase. I have currently bought GSS according to the daily pattern, will be buying more when it crosses (see weekly chart) the upper red trendline at $0.82, buying more when it breaks $0.82 (see monthly chart), and more after $1.17 after it crosses the height of the cup (see quarterly chart).
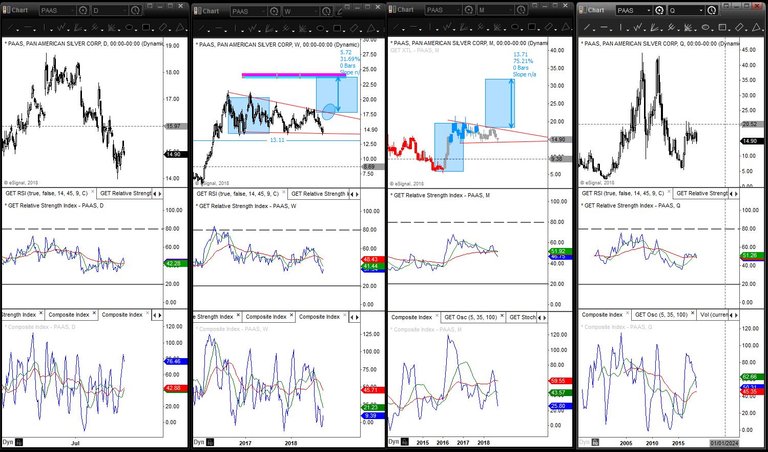
PAAS is looking quite promising right now. It looks very similar to GSS. As soon as PAAS breaks $18, it will be a buy from me for a short-term profit of $23.54 which is 31.69% (see weekly chart). And a monthly bull flag target of $32.05 or a 75.21% profit. I will double down after it breaks $22.10. I have a tight stop loss at $13.11. RSI is also very nice.
Have a good week. Safe trading…
This user is on the @buildawhale blacklist for one or more of the following reasons: