Bitcoin last 24 hours went below $100,000, will it recover above$100,000 ? Let's see what the chart say.
Technical Analysis of Bitcoin Based on the Chart
Price Movement and Trend
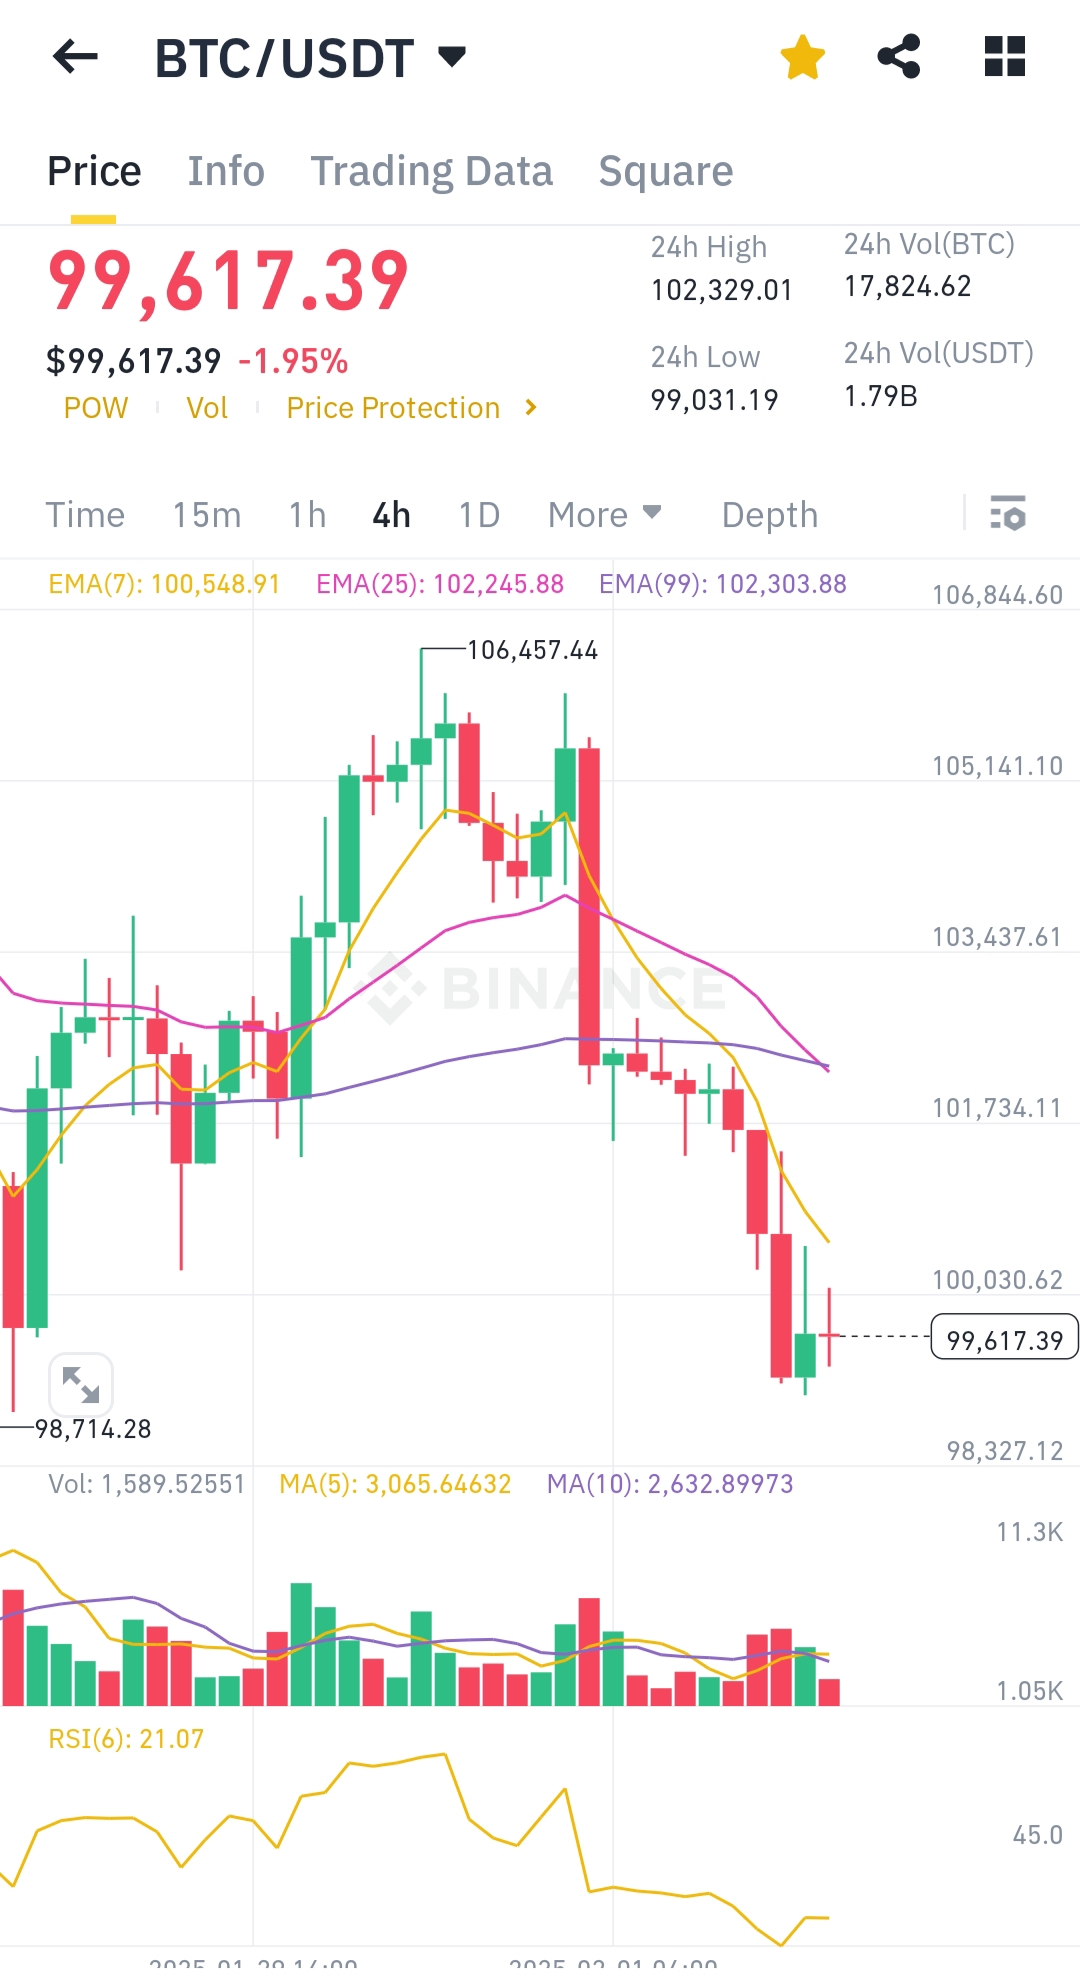
- Current Price: $99,617.39 (-1.95%)
- 24h High/Low: $102,329.01 / $99,031.19
- Trend: Downward trend evident as the price has dropped below key moving averages.
Exponential Moving Averages (EMA)
- EMA(7): $100,548.91
- EMA(25): $102,245.88
- EMA(99): $102,303.88
- The price is trading below all three EMAs, signaling strong bearish momentum.
Volume
- 24h Volume (BTC): 17,824.62
- 24h Volume (USDT): $1.79 billion
- Volume remains moderate but is not significantly high, indicating subdued market participation.
Relative Strength Index (RSI)
- RSI(6): 21.07
- RSI indicates that Bitcoin is in the oversold territory, suggesting the possibility of a short-term reversal or consolidation.
Key Support and Resistance Levels
- Support: $98,714.28
- Resistance: $102,303.88 (near EMA99)
Candlestick Patterns
- Recent candles show long wicks and a downward bias, highlighting selling pressure and failed recovery attempts.
Conclusion
Bitcoin is in a bearish trend, trading below key EMAs with oversold RSI. While short-term recovery may occur, caution is advised as the market sentiment remains weak.