Technical Analysis:
Price Action & Trend:
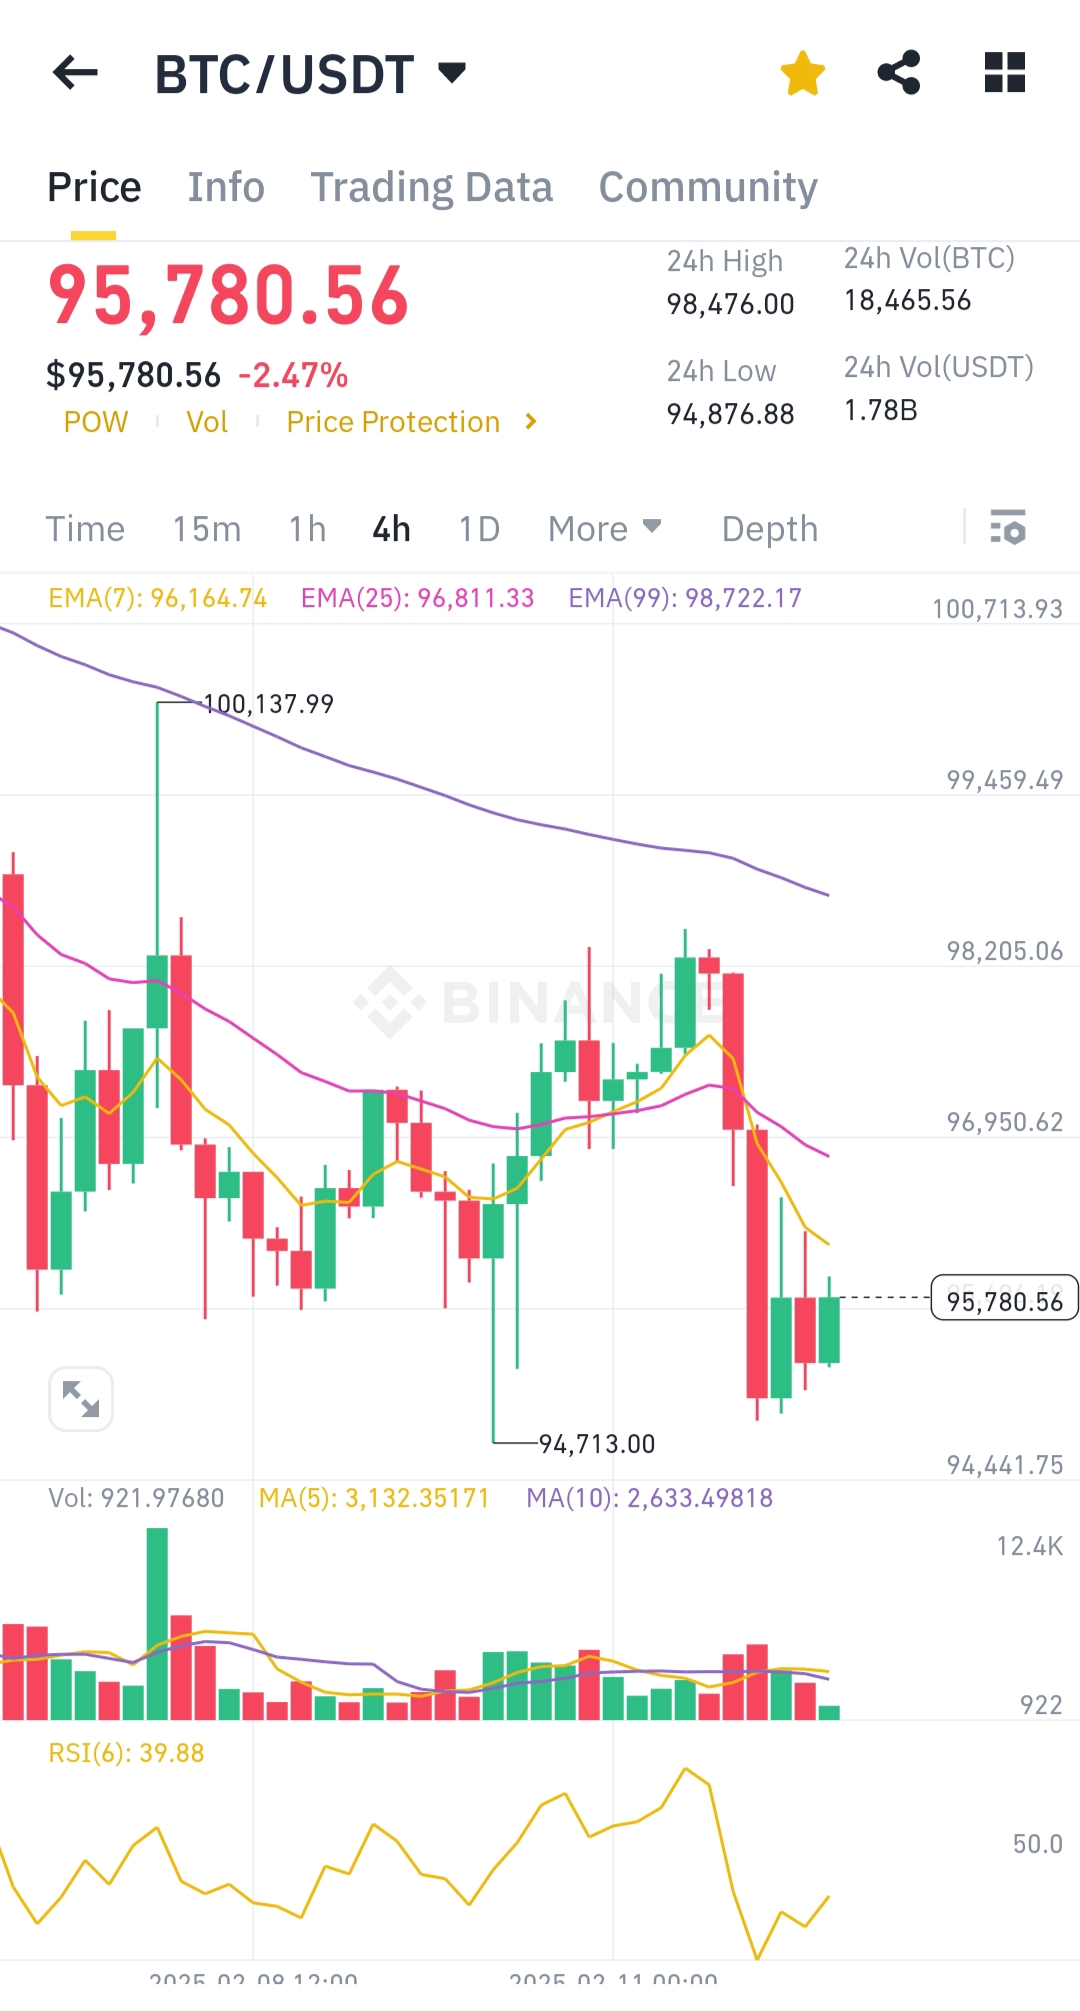
- Bitcoin (BTC/USDT) is currently trading at $95,780.56, showing a -2.47% decline in the last 4-hour session.
- The price hit a 24-hour high of $98,476 and a low of $94,876, indicating high volatility.
- The last few candles show rejection at higher levels, suggesting selling pressure.
Moving Averages & Resistance:
- EMA (7): $96,164.74 (Short-term trend)
- EMA (25): $96,811.33 (Mid-term trend)
- EMA (99): $98,722.17 (Long-term resistance)
- BTC is currently trading below all key EMAs, indicating a short-term bearish bias.
Support & Resistance Levels:
- Support: $94,713 (recent low), $94,441 (next key level)
- Resistance: $96,950, $98,205, and $99,459 (key zones to break for bullish momentum)
Volume & Market Strength:
- Volume: 921.97 BTC in the last 4-hour session, showing moderate activity.
- RSI (6): 39.88 (approaching oversold territory but not extreme).
Conclusion:
BTC is facing downward pressure, struggling below key EMAs. If it breaks $94,713, further downside is likely. A recovery above $96,950 may signal bullish strength. Traders should watch volume and RSI for signs of a bounce or further decline.