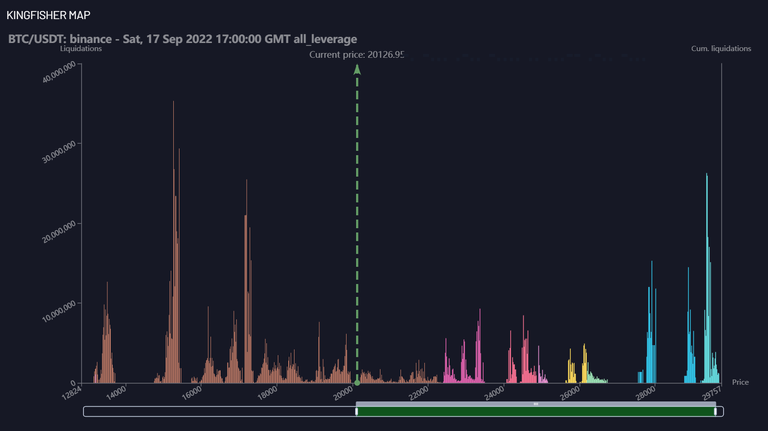
After liquidation of shorts above 19.9K, now much Longs liquidation to take near of price at 19.8K and 19.1K, otherwise next big peaks in south are at 17.2K and further on north towards 22.5K
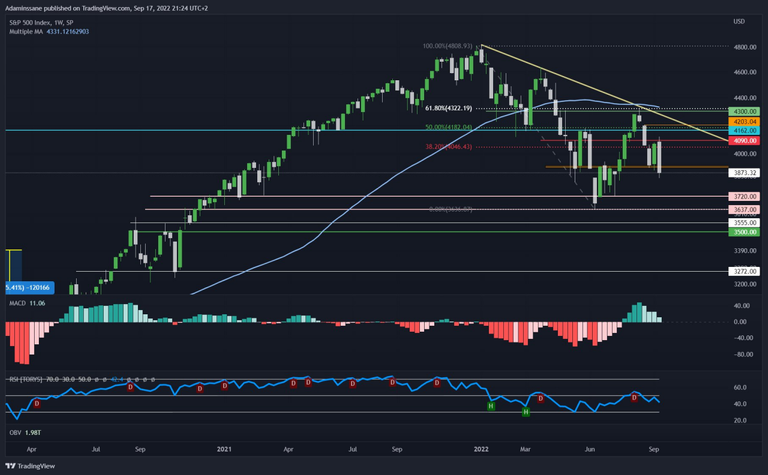
S&P 500 Index Weekly close below key Dynamic support level at 3900 with large red engulfing candle, bearish signal on BTC!
The RSI has already confirmed the bearish divergence below the level 50 and the MACD is almost in the red to confirm the return of the sellers.
The next supports to come on S&P 500 will be: 37 20 / 36 37 / 35 55 / 35 00 / 32 72
I'm just trying to follow the market, I'm learning from my mistakes and for the moment the market is telling me be careful I'm going to fall, but if it turns against me and goes up I'll say thank you for the small radius of the sun that you bring us.
The question: is it a real break out or a manipulation to come back to the levels above?
https://www.tradingview.com/x/GyFztI1M/
👉 Follow the links below to the best & Secured Exchanges that I use for trading & often gives rewards for using their platform like Learn & Earn Program, making deposit & Trading on spot or Futures, Trading Competition, ...etc.
📈 Binance: https://www.binance.com/en/register?ref=12258276
📈 FTX: https://ftx.com/#a=1768923
📈 Bybit: https://www.bybit.com/app/register?ref=7Wgmj
📈 Phemex: https://phemex.com/register?group=718&referralCode=BAR9K
📈 Bitmex: https://www.bitmex.com/app/register/xXePh3
📈 Kucoin: https://www.kucoin.com/ucenter/signup?rcode=Kvyf2d