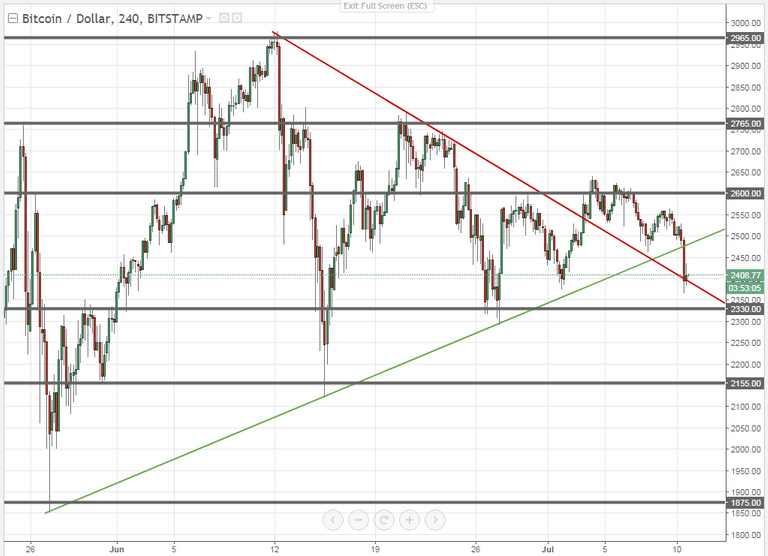
 BTCUSD recently broke out of a symmetrical triangle and moving up near the 1265$ mark where it hit a resistance level and moved back down by breaking the support trendline of the triangle and touching the broken resistance trendline of the triangle.
Price has tested the resistance trendline and it's a great chance that the price might start to climb back up.
Possible checkpoints of a price turnaround would be the 2500$ mark where the support trendline (green trendline) would behave as a resistance.
If the price manages to break through that resistance, a possible checkpoint would be the price zone between 2600-2650$.
that's good to know thanks a lot for sharing and keep on posting ;)
Thanks for commenting.