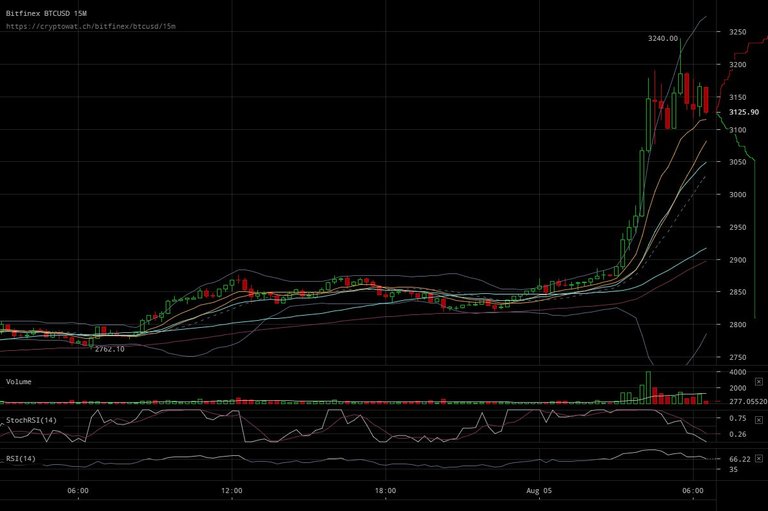
Bollinger Bands have opened on 15 minute candles and after around $500 Million of trade volume seem to be settling for short-term price range between $3160-$3310.

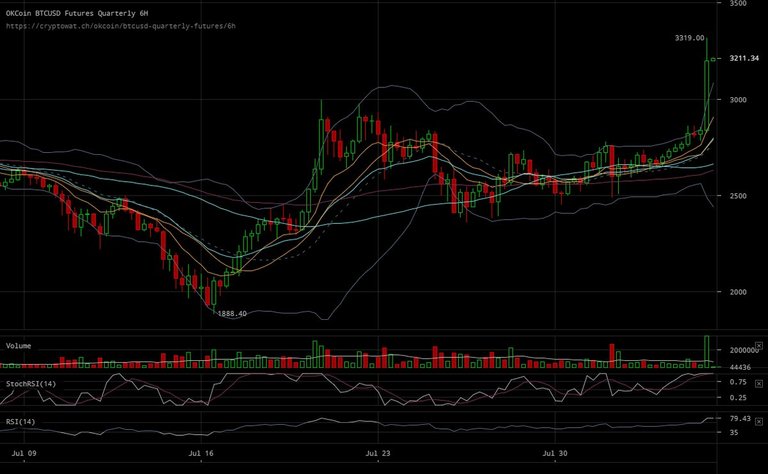
Long-term is looking consistent on the 30 minute candles with nearly $800 increase from $1826 on the 16th July with a slight lull for 2 weeks of sideways action to move another $800 mid-term price range $3240-$4325.

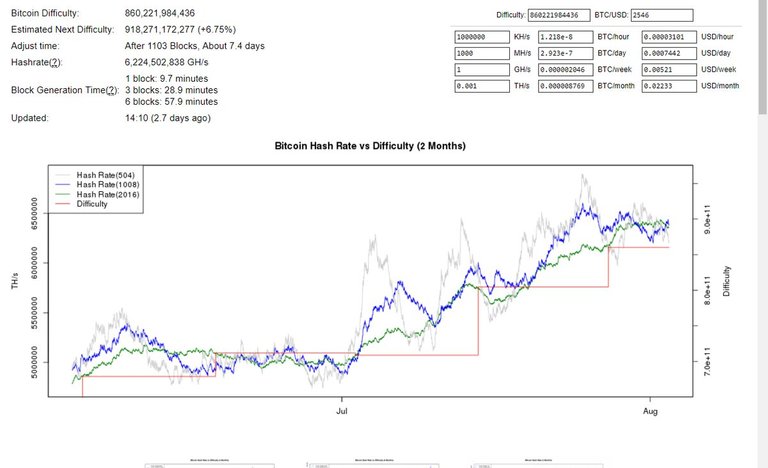
Difficulty change is not for another week so expect level of $3150 to hold easily.

A move above $3400 is needed for the next move with support at $3150.
For a move to happen so fast volume would have to pick up significantly at around $3 Million.
Levels to watch $3100-$3300
Move Below $3100 would signal reversal and a move above $3300 continued price development.
Not an obvious Buy nor Sell..HODL!!!
Check out #chartart for more Technical Analysis.
Disclaimer: Views contained are my own opinion based off of charts,trading is risky business do so at your own risk and dont trade more than your willing to lose.
Source: Charts = crypto.ch
Bitcoin Difficulty= bitcoinwisdom
Congratulations! This post has been upvoted and reestem from the new curation trail @animus.
Very Nice post Thanks !!