Ladies and gentlemen, greetings!
Here I am sharing with you the results of work been done on my trading indicators. I had to check all of my ideas in depth and now I am excited to share my story with you on Steemit.
For those of you who might remember, I was inspired by Jason Perls book “Demark Indicators” in 2014. Since then I was Tone Vays subscriber and for some time I was thinking about buying access to his version, but then I found it was not working properly, and expressed my suggestions on how to fix it. Tone answered me under one of his vids on YouTube, saying that he knows about these errors and that he does not have time to fix. I waited a fairly long time and since nothing changed, I started developing my own versions. I don’t want to say anything bad about Tone, I was grateful for free content and info, but I guess it wasn’t enough for 0.1 BTC as for me. To date, I continue to improve and have already developed several fundamental features that you will not find anywhere else.

In Depth:
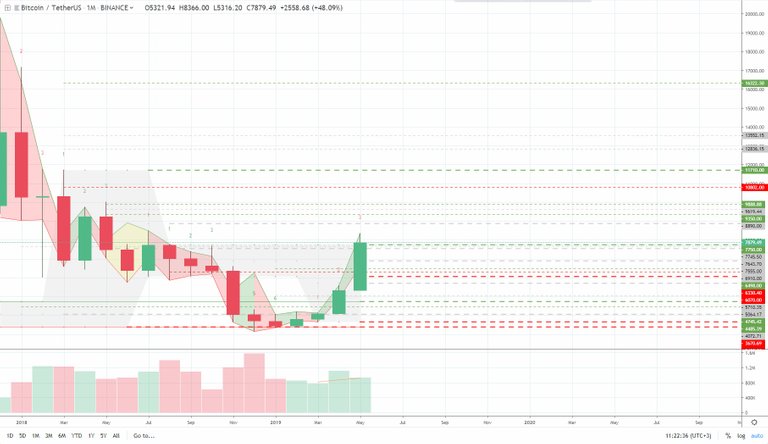
Median between support and resistance :
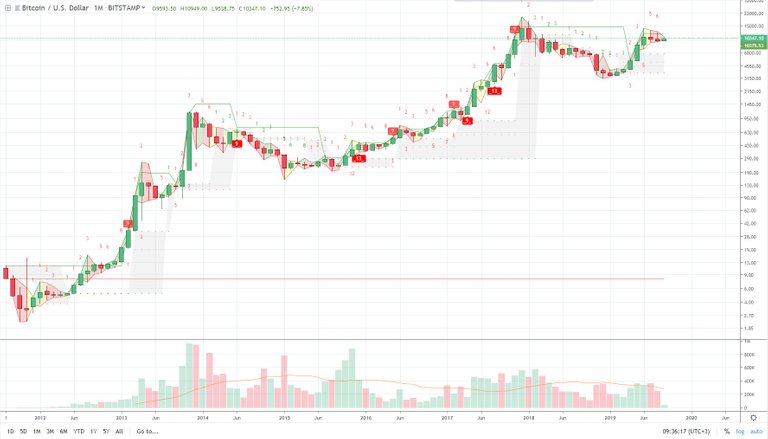
As you can see there are gray channels with green, gray, red dotted lines, so called support(red), resistance(green), median(gray) lines. The original idea for these was found in Jason Perl’s book “DeMARK INDICATORS” in section “TD Sequential vs. More Conventional Momentum Indicators”. I added the median line which has proven itself to be helpful and sometimes crucial. Best practice is to use these lines from low frequency timeframes down to high frequency timeframes. In other words you place infinite lines in continuation of current lines on monthly, weekly, daily and buy below red sell above green on daily or even 4h and so on.

Thickest lines from monthly, thinnest from daily.
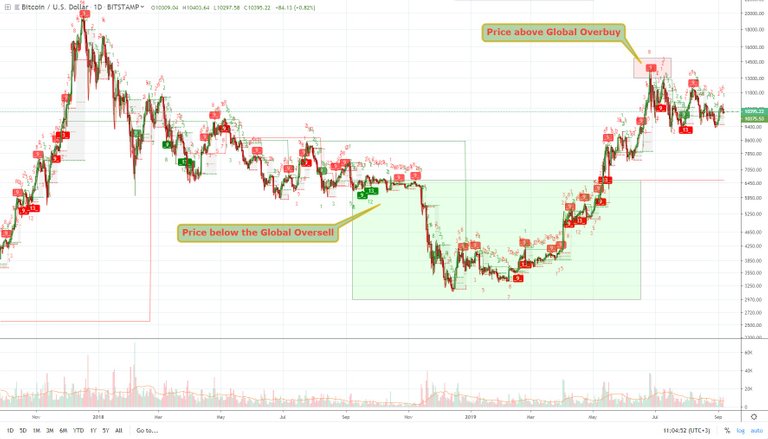
Global Oversell and Overbuy lines:
Green and red lines above and below I call Global Oversell and Global Overbuy. Also are very helpful, especially on low frequency timeframes(monthly, weekly, daily). Best practice for long term traders is to buy below red and sell above green.

Global Oversell and Global Overbuy levels
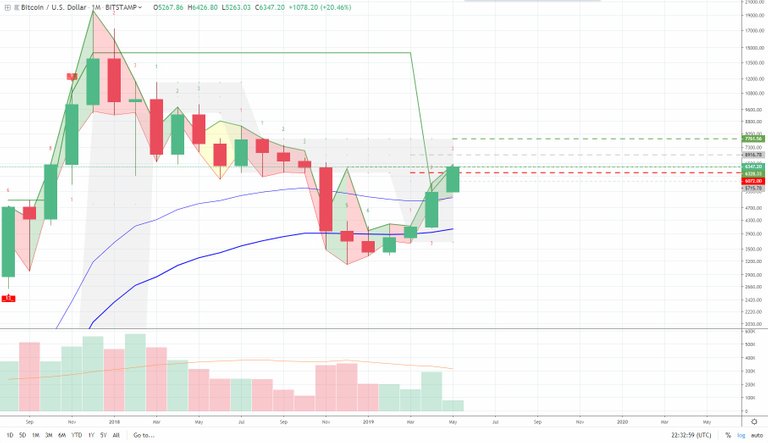
Expectation points:
Colorful channel is based on what I call expectation points. Every candle has its expectation points for highest and lowest prediction based on past data. These are my original ideas. The cells color provide indication on the current mood. Green for bullish, red for bearish and yellow for doubt. The distance between these two points indicates the expected volatility and the magnitude of current interest. There is also a very important indication that I call “Unmet Expectation” when the price does not reach one of the expected points. These are important since price usually comes back to these levels.

Return to previously unmet expectation
For a year, I shared access for free, but since none of my free subscribers actually helped me improve it, I stopped free access.
Original post: https://medium.com/@vir2alexport/progress-update-1c28c91eec5c
Please check out my indicators https://www.tradingview.com/u/SequentialVision/#published-scripts
For more tools visit my website http://www.armade.net

Regards!
Hello,
We have contacted you on Twitter to verify the authorship of your Steemit blog. We would be grateful if you could respond to us via Twitter, please.
Please note I am a volunteer that works to ensure that plagiarised content does not get rewarded. I have no way to remove any content from steemit.com.
Thank you
Congratulations @qpayct! You have completed the following achievement on the Steem blockchain and have been rewarded with new badge(s) :
You can view your badges on your Steem Board and compare to others on the Steem Ranking
If you no longer want to receive notifications, reply to this comment with the word
STOPVote for @Steemitboard as a witness to get one more award and increased upvotes!
!sc ban
Failed Authorship Verification.
Banned @qpayct.