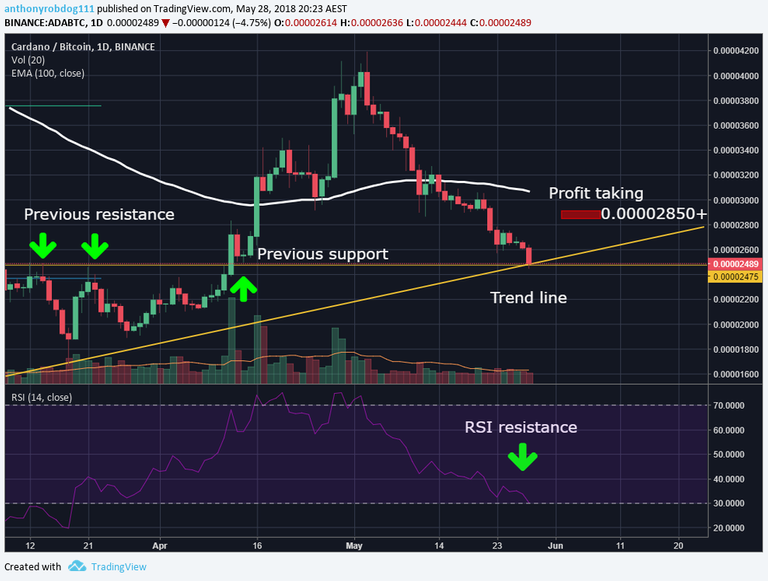
There are large groups of confluent support and it has recently undergone a large correction, finding support in these regions. Have stop loss set tight 0.0002350.
Yesterday!

Since then we have seen a large green candle bouncing off this confluent support of RSI, trend line and previous highs and support resistance. Now we will look at the significance of this move on a smaller time frame.

On the 5 minute it can be seen, that the buyers have come back with large volumes, and RSI has spiked to very bullish regions on 5 and 15 minute time frames.

It can be seen in the one hour chart, that there will likely be the first resistance at the 55 EMA and 60 RSI, roughly the 0.0002550 region, if this is to break it would confirm a short term uptrend.
