
Welcome to the daily financial report about the Hive blockchain.
All the information presented in this report is based on the data collected from the blockchain until 2024-01-08 midnight UTC. This report aims to provide you with a clear view of what is happening on the Hive blockchain.
 Este post está traducido al español - aquí
 Dieser Beitrag ist ins Deutsche übersetzt - hier
 Une version en français de ce post est disponible - ici
1. Price
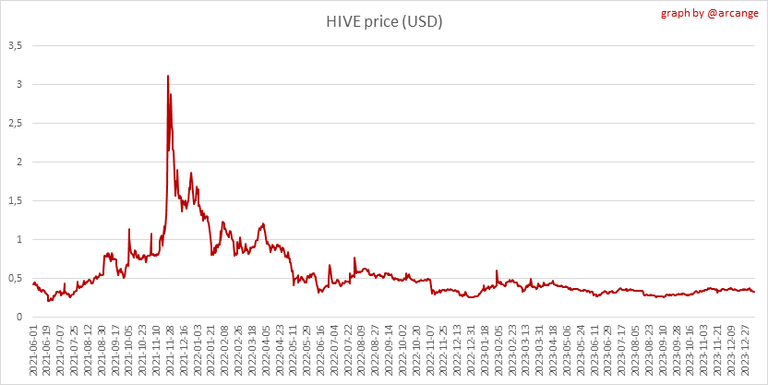 | 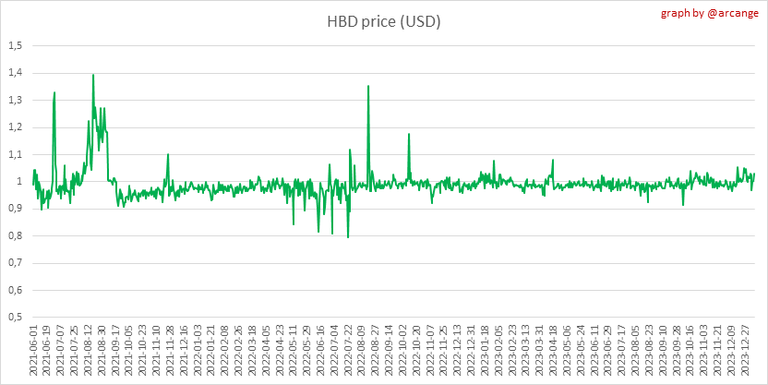 |
These graphs show the evolution of prices in USD for HIVE and HBD.
2. Supply

This graph shows the evolution of HIVE virtual Supply. The virtual supply is the sum of HIVE supply (liquid and staked HIVE) and HBD supply (converted into HIVE).
The graph also displays the debt ratio (HBD supply / HIVE virtual supply). Keep in mind that since hardfork 24 funds in the treasury (@hive.fund HBD balance) don't count towards the HBD debt ratio.
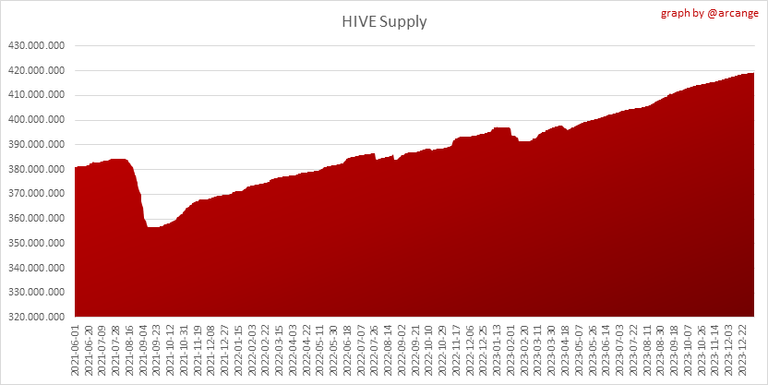 | 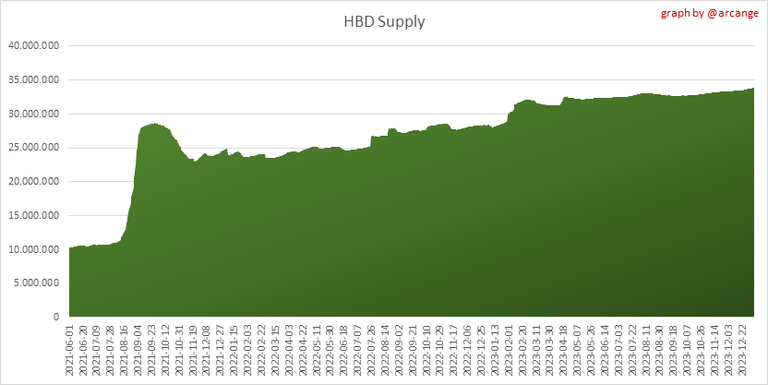 |
These graphs show the evolution of the HIVE Supply (both liquid and staked) and the HBD supply.
 | 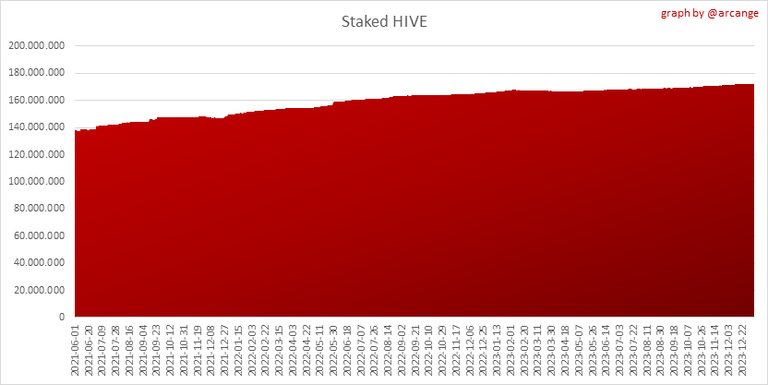 |
These charts show the evolution of the liquid HIVE and the staked HIVE (Hive Power).
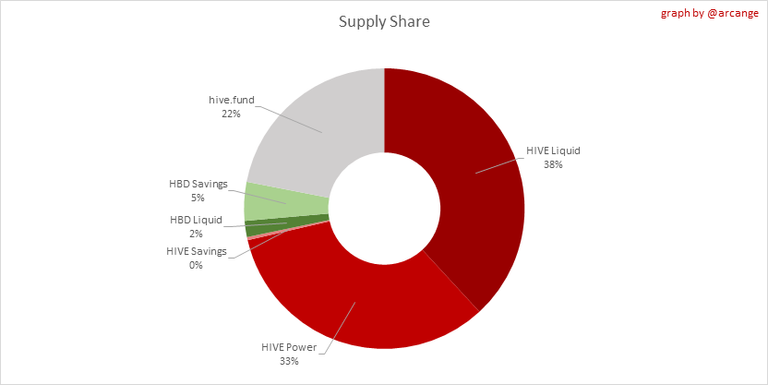
This graph shows the overall Hive tokens distribution.
3. HBD Savings
| Account | Deposit | Account | Withdrawal |
|---|---|---|---|
| @newilluminati | 6,460.550 HBD | @shinoxl | 1,108.582 HBD |
| @sascha.held | 3,415.909 HBD | @felipejoys | 592.598 HBD |
| @riverflows | 2,677.391 HBD | @borislavzlatanov | 400.000 HBD |
| @crypt0gnome | 428.798 HBD | @gringo211985 | 350.000 HBD |
| @shinoxl | 371.965 HBD | @jongolson | 321.951 HBD |
| @intinte-vault | 205.491 HBD | @namelessnameless | 220.000 HBD |
| @hhayweaver | 200.000 HBD | @luis96xd | 135.000 HBD |
| @medical-hall | 163.430 HBD | @rsstarpro | 100.000 HBD |
| @jeffbuilds | 141.251 HBD | @quantumg | 100.000 HBD |
| @hivesql | 107.874 HBD | @goldstreet | 68.000 HBD |
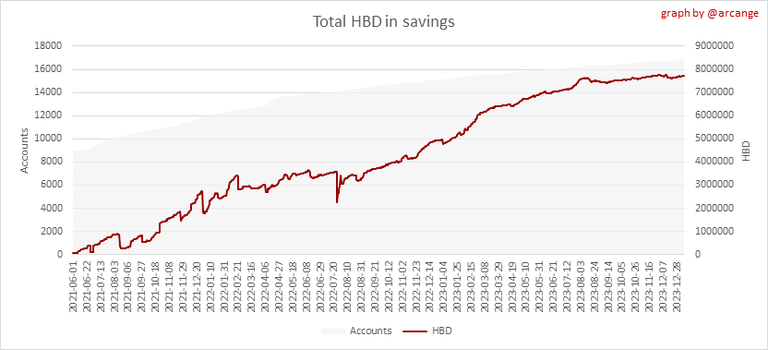
This graph shows how much and how many accounts store HBD in savings. The table below shows the topmost HBD deposits and withdrawals of the day.

Note: As of 2021-06-30 (HF25) interest is only paid for HBD which are stored in savings.
This chart shows the amount of interest paid each month for holding HBD and how many accounts received such interest.
4. Balances

This graph shows the number of HIVE, both liquid and in savings, held by all accounts.

This graph shows the number of HBD, both liquid and in savings, held by all accounts. It also displays the amount of HBD stored in the Decentralized Hive Fund (DHF).
5. Conversions
Note: As a reminder, conversion requests are only finalized after 3 days. It is only then that it is known exactly how many HIVE were burned in return for the HBD received at the time of the conversion request.
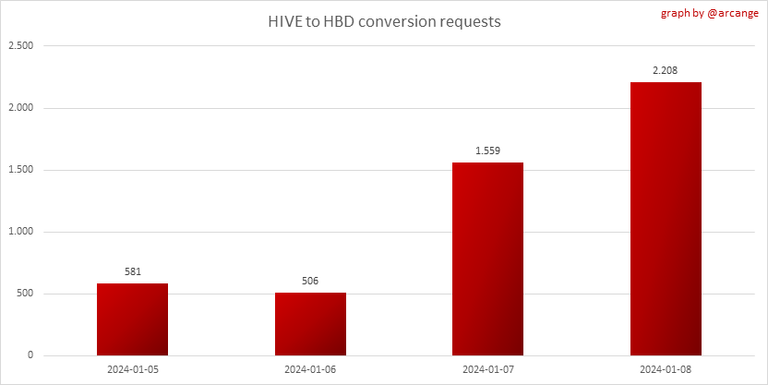
This graph shows the number of HIVE collateralized due to requests to convert HIVE to HBD over the past few days.
 | 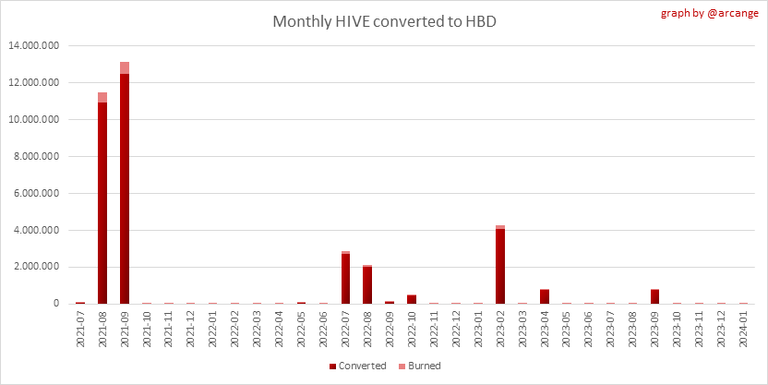 |
These graphs show the number of HIVE effectively used by the conversion process (HIVE converted and 5% HIVE fee which is burned) each day and month when requests to convert HIVE to HBD have been finalized.
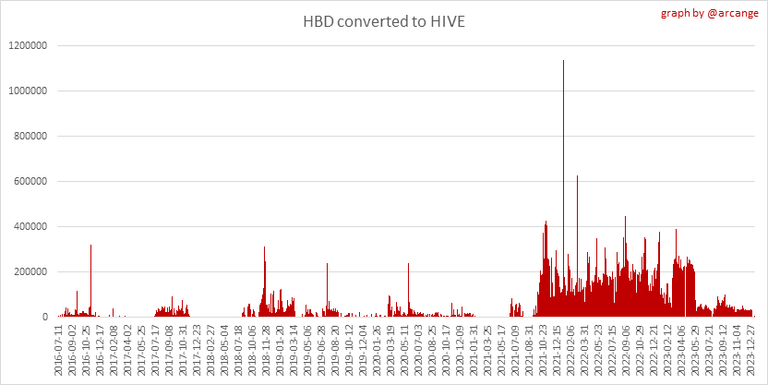 | 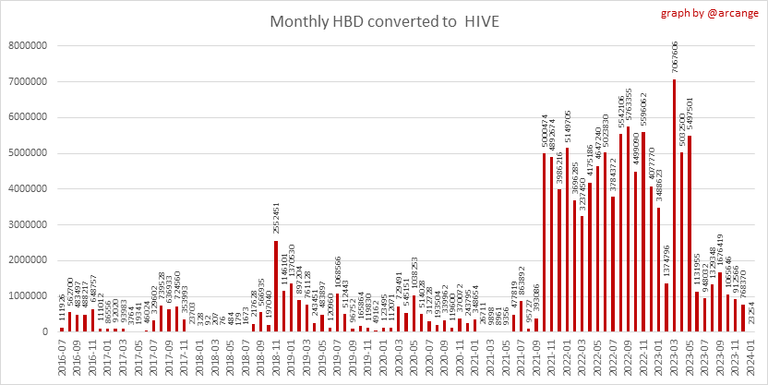 |
These graphs show the number of HBD burned, each day and each month, following requests to convert HBD to HIVE.
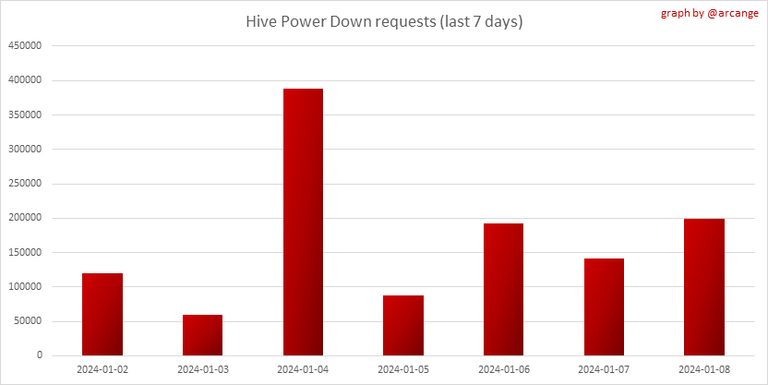
6. Powerup and Powerdown
| Date | Account | Amount |
|---|---|---|
| 2024-01-08 12:52:57 | @nuthman | 67,280.188 HIVE |
| 2024-01-08 09:36:36 | @therealwolf | 40,211.672 HIVE |
| 2024-01-08 09:37:18 | @riverflows | 19,829.032 HIVE |
| 2024-01-08 11:19:06 | @muratkbesiroglu | 19,501.030 HIVE |
| 2024-01-08 12:07:30 | @ua-promoter | 15,173.165 HIVE |
| 2024-01-08 08:56:42 | @prayzz | 5,467.290 HIVE |
| 2024-01-08 08:56:18 | @prayzz | 5,425.900 HIVE |
| 2024-01-08 02:37:48 | @equipodelta | 4,017.545 HIVE |
| 2024-01-08 02:37:33 | @equipodelta | 2,756.770 HIVE |
| 2024-01-08 12:37:03 | @eastmael | 1,900.092 HIVE |
This graph and table show the amount of powerdown initiated over the last 7 days, and the largest initiated on this day.
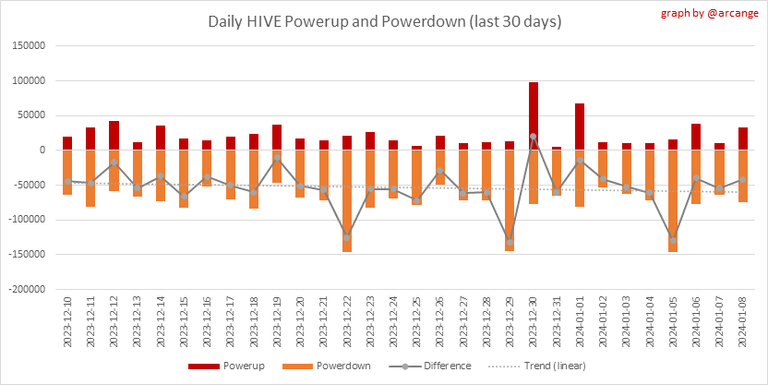
| Account | Powerup | Account | Powerdown |
|---|---|---|---|
| @vindiesel1980 | 11,989.349 HIVE | @jphamer1 | 30,831.120 HIVE |
| @cheftony | 1,950.707 HIVE | @leo.voter | 4,940.509 HIVE |
| @sbi2 | 1,740.411 HIVE | @balte | 3,927.456 HIVE |
| @demotruk | 1,618.688 HIVE | @steempeak | 2,919.208 HIVE |
| @sbi3 | 1,566.370 HIVE | @ausbitbank | 2,515.472 HIVE |
| @sbi5 | 1,409.733 HIVE | @globalprooftrust | 2,156.639 HIVE |
| @sbi6 | 1,263.389 HIVE | @poshtoken | 1,535.721 HIVE |
| @sbi7 | 1,142.420 HIVE | @tad.galahad | 1,406.985 HIVE |
| @sbi9 | 1,028.178 HIVE | @edicted | 1,005.042 HIVE |
| @rsstarpro | 948.121 HIVE | @specific | 964.842 HIVE |
This graph shows the daily HIVE power-up, power-down, and the resulting variation over the last 30 days. The table shows the topmost power-ups and power-downs of the day.
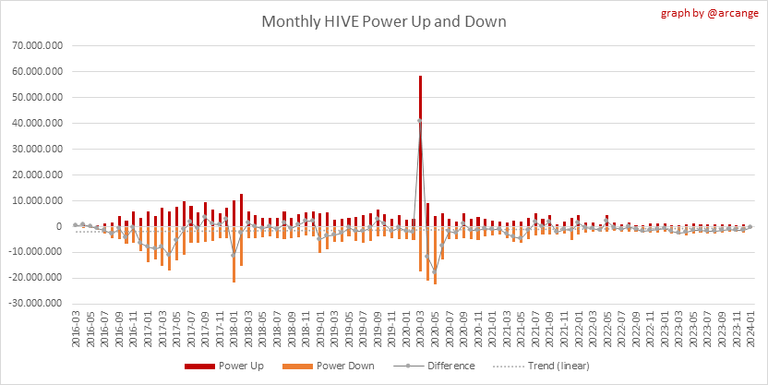
This graph shows the monthly HIVE power-up, power-down and the resulting variation.
Values for the last 3 months
| Period | Powerup | Powerdown | Difference |
|---|---|---|---|
| 2024-01 | 197,013.000 | 630,136.000 | -433,123.000 |
| 2023-12 | 889,719.000 | 2,255,634.000 | -1,365,915.000 |
| 2023-11 | 694,882.000 | 2,014,901.000 | -1,320,019.000 |
7. Transfers
These graphs show the volume (in USD) of HIVE and HBD transferred between accounts.
8. Exchanges
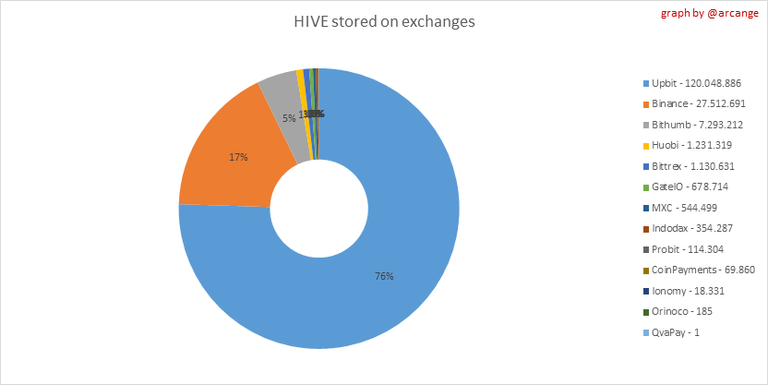 |  |
These graphs show the amount and distribution of HIVE and HBD stored on the exchanges where they are listed.
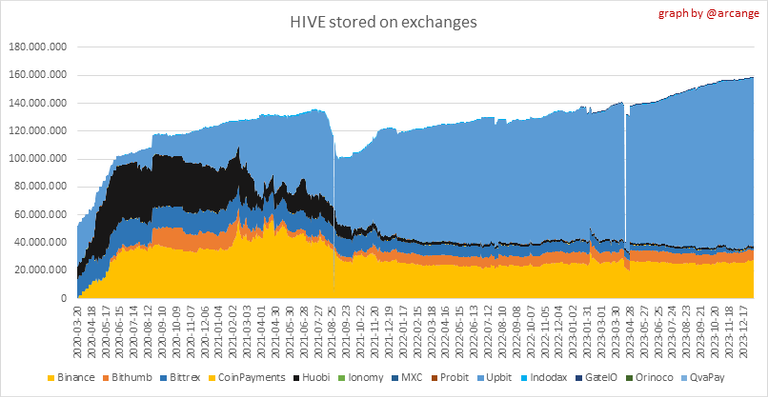 | 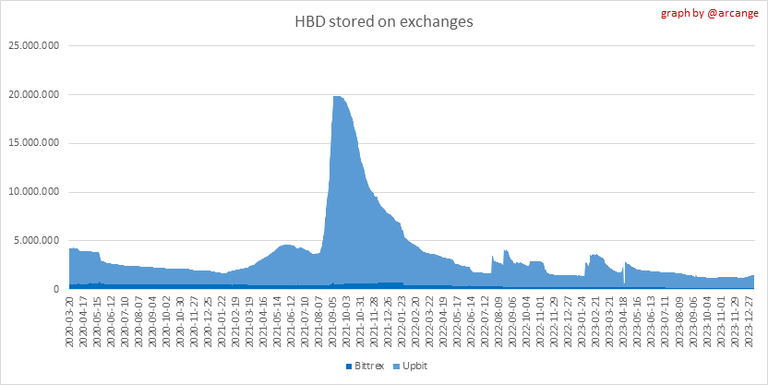 |
These graphs show the daily evolution of HIVE and HBD stored on the exchanges where they are listed.
I hope you find those stats useful. If you would like to see additional stats, feel free to drop me a comment. Your feedback is than welcome.
Thanks for reading.
Check out my apps and services


good work fam
This chart of yours looks like a big project.
Which is part of some big organization.
A lot of detail must have gone into preparing the financial report of this blackion.
Hello @ankurkarma, thank you for your comment. Indeed, producing these reports requires data analysis and understanding of the Hive blockchain. However, it's not part of a big organization but rather an individual effort to provide valuable insights to our community. I'm glad you find it useful!
As an insights person I love the depth of data you have in this post. I am new and have still not internalized the entire working of the blockchain but can see the value of this data. On my part I have been trying to understand how the Hive and HBD pools are refreshed, how HBD manages to hold position to dollar, and how interest is generated when HBD is put in savings. I am new and am trying to work through the documentation, help and online discussions around it. If you have any link that can help me with my research please do help. Thanks!
Well, I would not say people should not power down since they own the money but at the same time, I wish everyone could just hold but that’s not possible
Great update
Many people are really saving their HBD and many powering up and down...nice compilation there with awesome details
Thank you for your feedback! I'm glad you found the information useful.
I prefer to power up, but there have been times when I needed to power down... Thanks for stopping by one of my recent posts...
No problem, everyone is free to do what they want with their assets.