Hive has an intriguing tokenomics. It has a dual token system with a native Layer 1 built in stablecoin. The HIVE and HBD marriage. This dual system has its challenges when it comes to inflation and projecting it into the future. I have been doing the Hive Inflation and Supply monthly report for a long time now, but that is backwards looking. It looks at past realized data and somewhat compares it to the projections for the period.
But what about the future projections? The long-term outlook, a 100 years into the future? Let’s take a look!
Here we will be looking at:
- Current inflation and projections
- 100 years Hive inflation in % terms
- 100 years Hive inflation in HIVE per block
- 100 years Hive inflation in HIVE per year
- 100 years HIVE supply
- The role of the virtual HIVE supply on the inflation
Current Inflation and Projections
At the moment in 2024 the current Hive inflation is around 6%. In the past years, starting from 2016 when the inflation was projected at 9.5%, the realized inflation has usually varied from the projected.
Here is the realized inflation in the past 8 years:
| Year | New HIVE | HIVE Supply | Projected | Realized |
|---|---|---|---|---|
| 2016 | 29,420,609 | 242,842,066 | 9.50% | 12.12% |
| 2017 | 21,412,286 | 264,254,352 | 9.18% | 8.10% |
| 2018 | 28,296,297 | 292,550,649 | 8.76% | 9.67% |
| 2019 | 43,050,832 | 335,601,480 | 8.34% | 12.83% |
| 2020 | 44,522,623 | 380,124,104 | 7.92% | 11.71% |
| 2021 | -10,032,345 | 370,091,759 | 7.50% | -2.71% |
| 2022 | 24,633,172 | 395,039,989 | 7.08% | 6.24% |
| 2023 | 23,740,875 | 417,577,086 | 6.66% | 5.69% |
As we can see there have been some differences between the realized and projected, especially in 2019, 2020 and 2021. In 2019 and 2020 the inflation was higher, while in 2021 it ended negative.
When it comes to the long-term outlook of the Hive inflation the data that is out there is usually a middle term outlook up to the next 5 to 10 years, 2030 to 2035. There is a data on the developers.hive.io for the period of 2016 to 2045:
| Year | Supply | Inflation | New Supply |
|---|---|---|---|
| 2016 | 250,000,000 | 9.50 | 23,750,000 |
| 2017 | 273,750,000 | 9.08 | 24,854,398 |
| 2018 | 298,604,398 | 8.66 | 25,854,554 |
| 2019 | 324,458,952 | 8.24 | 26,727,942 |
| 2020 | 351,186,894 | 7.82 | 27,452,027 |
| 2021 | 378,638,921 | 7.40 | 28,004,740 |
| 2022 | 406,643,661 | 6.98 | 28,364,989 |
| 2023 | 435,008,650 | 6.55 | 28,513,181 |
| 2024 | 463,521,832 | 6.13 | 28,431,762 |
| 2025 | 491,953,593 | 5.71 | 28,105,742 |
| 2026 | 520,059,335 | 5.29 | 27,523,204 |
| 2027 | 547,582,539 | 4.87 | 26,675,768 |
| 2028 | 574,258,308 | 4.45 | 25,558,997 |
| 2029 | 599,817,304 | 4.03 | 24,172,733 |
| 2030 | 623,990,038 | 3.61 | 22,521,348 |
| 2031 | 646,511,386 | 3.19 | 20,613,886 |
| 2032 | 667,125,272 | 2.77 | 18,464,106 |
| 2033 | 685,589,378 | 2.35 | 16,090,399 |
| 2034 | 701,679,777 | 1.93 | 13,515,587 |
| 2035 | 715,195,364 | 1.51 | 10,766,608 |
| 2036 | 725,961,973 | 1.08 | 7,874,074 |
| 2037 | 733,836,047 | 0.95 | 6,971,442 |
| 2038 | 740,807,489 | 0.95 | 7,037,671 |
| 2039 | 747,845,160 | 0.95 | 7,104,529 |
| 2040 | 754,949,689 | 0.95 | 7,172,022 |
| 2041 | 762,121,711 | 0.95 | 7,240,156 |
| 2042 | 769,361,868 | 0.95 | 7,308,938 |
| 2043 | 776,670,805 | 0.95 | 7,378,373 |
| 2044 | 784,049,178 | 0.95 | 7,448,467 |
| 2045 | 791,497,645 | 0.95 | 7,519,228 |
Quote:
Inflation narrows 0.01% every 250k blocks, since HF16. At block 7,000,000, there was a 9.5% instantaneous inflation rate, decreasing to 0.95% at this rate of 0.01% every 250k blocks. This narrowing will take approximately 20.5 years and will complete on block 220,750,000.
The above data is mostly correct, especially when it comes to the calculated percent %. What is somewhat undefined is the supply, or the base that is taken when calculating the new hive. What needs to be taken as a base is the virtual HIVE supply that at the moment in 2024 is close to 550M, while in the table above it is at 463M. The regular HIVE supply is lower than this actually and it is at 430M HIVE.
100 Years Hive Inflation in % Terms
The formula to calculate the percent for the inflation is tied to the block number:
Hive Inflation [%] = 9.5 - HeadBlockNumber / 25000000
Note the divider 25M is the 250k blocks multiple with 100.
The inflation will keep going down up until 0.95% in 2037 and then it will stay at that level for all the next years.
Here is the chart:
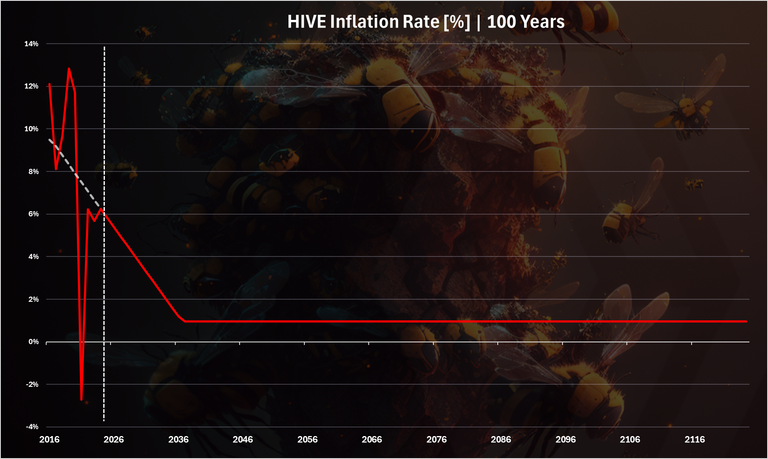
The dotted line is where we are now.
As we can see the first 20 years are sort of distribution mode HIVE, especially the first 10, when the inflation is higher than 5%. After 2026 the inflation will drop below 5% and is going down fast each year to 0.95% in 2037, after what it stays there.
The HIVE inflation rate in percentage terms [%] is tied to the block number that is basically the only variable in the equation. There is no unknows or possible variation. It is as presented above and it will stay that way if the code doesn’t change via a hardfork.
I have also digged a bit in the Gitlab repo for Hive. You can fin the code for the inflation formula here, at line 2700 and after.
100 years Hive Inflation in HIVE per Block
After the calculation of the percent for the Hive inflation next we need to calculate the amount of new HIVE per block. Some other chains usually define the tokens per block and afterward calculate the inflation. In the case of Hive is percent first, tokens per block later.
To get the tokens per block we need the virtual Hive supply and the blocks per year. The code line from the gitlab link above looks like this:
auto new_hive = ( props.virtual_supply.amount * current_inflation_rate ) / ( int64_t( HIVE_100_PERCENT ) * int64_t( HIVE_BLOCKS_PER_YEAR ) )
I want to emphasize the virtual Hive supply here as it is important to distinguish this from the regular Hive supply. As example at the moment the regular Hive supply is at 430M, while the virtual is at 546M. It’s quite the difference. What is taken into account matters a lot. The virtual Hive supply includes the HBD supply as well (including the HBD in the DHF), converted in Hive. Because of this conversion the added supply from HBD can very a lot since it is price sensitive. When the prices moves, so does the virtual supply, just in the opposite direction.
Again, using regular or virtual Hive supply is an important parameter to distinguish. It is the base in the formula that determines how much new Hive will be created.
On Hive one block is created every three seconds, which means:
| Interval | Blocks |
|---|---|
| minute | 20 |
| hour | 1,200 |
| day | 28,800 |
| year | 10,512,000 |
A 10.5M blocks per year. If we do an example calculation with the current data of 546M virtual HIVE supply and inflation rate of 6% we get 546M*6%/10.5M = 3.1 HIVE per block. On a yearly basis this is more than 32M HIVE, that is above the projected one of around 25M because of the virtual supply. Furthermore, we even need to consider that not all new inflation is rewarded in HIVE tokens, but some of it is in HBD, meaning that less than the 32M presented here will be put in circulation in HIVE. And finally, we have the user base that is converting HIVE and HBD back and forth through the year that will offset all of this.
It’s hard to predict how things will come out with this type of dynamic, when the inflation rate is partially dependent on the price of Hive.
Here is the chart:
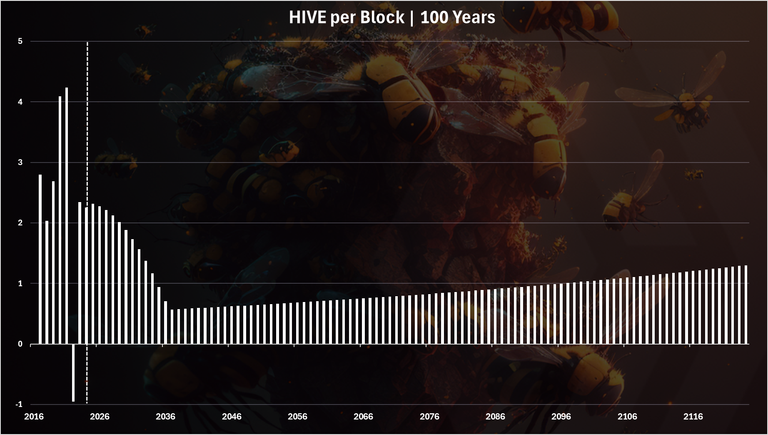
As we can see in the past period the new Hive per block starts with around 3 then goes up to 4, drops to around 2.5. In the coming years it should go down each year reaching 0.6 Hive per block in 2037, and it will steadily increase in the following decades and it will reach 1.3 Hive per block in a 100 years. Still farm from the 3 to 4 Hive per block that we had in the beginning.
Disclaimer: The calculation of the projected Hive per block is made using the regular Hive supply, not the virtual Hive supply. The virtual Hive supply is impossible to predict.
When we convert this to new Hive per year we get this chart:
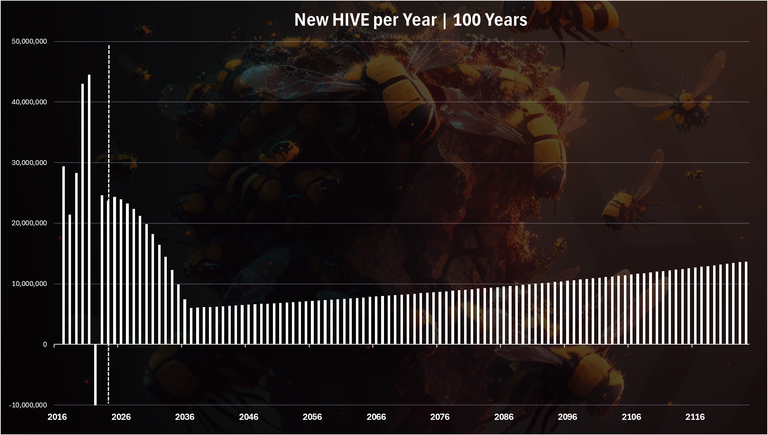
Up to 40M Hive per year was created in 2019 and 2020. Then in 2021 more than 10M was burned. In 2022 and 2023 the created Hive is close to the projected one around 25M per year. 2025 should be the year with the maximum Hive created in absolute terms, after which it will start to go down and will reach a minimum of 6M in 2037. After this it will start to go up slowly and will reach 13M per year in 100 years from now.
100 Years HIVE Supply
Let’s take a look at the projected Hive supply in 100 years.
Here is the chart:
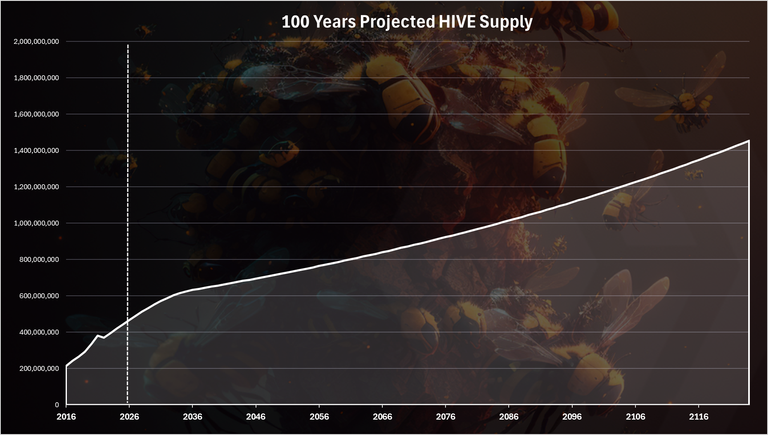
We can notice that in the long term the Hive supply keeps growing and given enough time it will increase multiple times if conversions stay neutral. What I mean by conversions is basically the increase in the Hive supply and the HBD supply goes in parallel. Things can change a lot in this chart if HBD starts growing more than Hive, basically burning HIVE in the process.
The current Hive supply of 430M should double in 45 years, or in the year 2070 when it will be 860M. A 100 years from now the Hive supply should be around 1.5B, or increasing more than three times from now. Once the minimum inflation of 0.95% is reached it takes around 70 years for the supply to double. All of this under the assumption of neutral conversions and no changes in the code via hardforks.
The Role of the Virtual HIVE Supply on the Inflation
As previously mentioned, the virtual Hive supply is a function of the HBD supply (including the DHF) and the price of Hive or the median Hive price to be more accurate that is a median from the past 3.5 days. Because it incorporates the Hive price it is basically impossible to predict, especially in the long run. Knowing the Hive price in 100 years from now is a phantasy.
But the virtual Hive supply plays a big role in the amount of new Hive entering in circulation. It doesn’t affect the inflation rate in percentage, but the absolute hive yes. New Hive = Inflation Rate * Virtual Supply. This can distort the projections made above by a lot, especially in the long term. The numbers above can be completely different. This once again is because of the HBD in circulation and the Hive price. I’m not totally sure at this point should we change the code and make the regular Hive as a base for calculating the new Hive put in circulation. This is a wide topic for discussion and I might made a separate post for it. Using the regular Hive as a base will improve the predictability a bit, but even then, the regular Hive can be increased or decreased by the conversions. This unpredictability is basically an after effect of HBD. As long as HBD exists as a Hive derivative, projecting the long-term future Hive inflation and supply is impossible. We better make HBD counts 😊!
All the best
@dalz
Simple message for the ones that didn't understand the post...
Get HIVE NOW while its cheap! 😅
Maybe that's for the better, compared to having a predetermined inflation schedule and no way to adjust it (other than through HFs). The difficulty arises in making the correct adjustments at the right times while thinking strategically for the perspective.
The realized vs projected makes me feel like everything that goes on at hive.
Awesome post!
Thank you!
I love this posts @dalz !
Thanks for sharing them.
so holding long time ganna not be worth?
No, if you need to price conclusion from above it is that its impossible to predict
This platform is really promising because of the long term plans I’m seeing here
That’s nice!
Interesting post and data. While looking 100 years into the future is too much for me [a lot of things can happen], it is still nice to see how Hive is expected to behave. Thank you for this.
One thing I noticed is that Hive had long term goals for you to talk about 2037
I’m glad about that
Go Hive!
Great details as always good friend Dalz.... I always depend on your blogs for some statistics and what's going on here.. It's interesting how factors like inflation and supply projections are interconnected, especially considering the impact of virtual Hive supply and HBD conversions. Great insights Dalz wow
@tipu curate
Upvoted 👌 (Mana: 29/59) Liquid rewards.