
English Version
In the last post, I started an analysis of the current situation of the BTC/USDT price, and I had told you that a support area could be noticed around the 30,000 USD.
It is important to mention that for the Trader, it is of utmost relevance to take into account the supports, resistances and places where the price can get to make a specific movement as AREAS OR ZONES probable, and not as POTS certain where something is going to happen.
When we take that into account, we understand that if we notice a support at 30,000 USD, then it means that the price can go down even below 30,000, reaching values such as 29,900, 29,800, 29,700 USD and still be respecting the support so that, after a few hours, it makes the respective rebound that positions it again above the mentioned support.
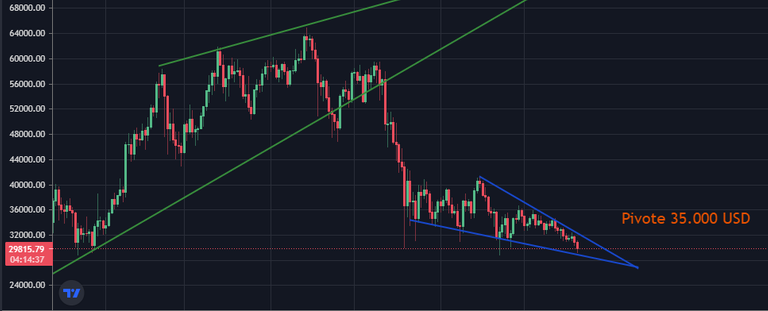
That said, we can see in yesterday's chart, how it has been forming a bullish wedge pattern (where the tip of the wedge is directed downwards), The reason why yesterday I did not post the analysis of the asset, is because when I noticed this pattern I wanted to wait a few hours until the rebound happened, to be able to notice the way the asset behaves and thus be able to understand where it could be heading.
Yesterday's chart
Today's chart
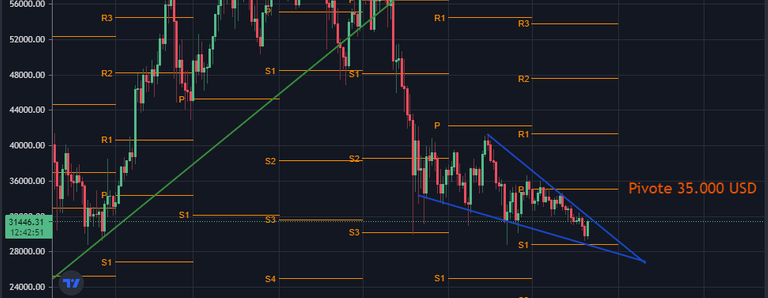
Here we can see how after a few hours, the bounce happened perfectly (even respecting the weekly pivot points support zone), and now the price is positioned again above 30,000 USD.
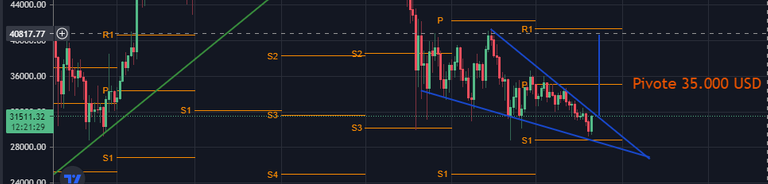
We can also observe the possible target of the asset according to this wedge pattern (marked with the vertical blue line), which coincides with the target mentioned in the previous post; the 40,000 USD.
It is noted that said target coincides with R1 (Resistance 1, located in the same area of 40500 USD), of course this would only be possible if it exceeds the weekly pivot point at 35,000 USD.
To conclude, we can conclude that:
The important values of the asset at the moment are 3:
30,000 USD, defines us the most important support at the moment, before the asset goes to "sipote" hahaha.
35,000 USD, a current resistance and that being a pivot point, would mark a change in the partial trend of the asset, taking it up to the next resistance marked.
40,000 USD, the next marked resistance and possible end of the partial upward movement, which means that if it reaches that point, you would have to re-evaluate the situation to understand what else you could do. I generally manage this way, as this is how I learned it; one step at a time, without assuming targets too far out as the market can easily change direction and you have to constantly re-evaluate what is happening.
NOTE: It is important to know that all the analysis shared here is mostly educational in intent and is not intended as an investment suggestion. That is why I try to give details of my way of analyzing, so that you can understand where the areas that I consider of importance in the operation arise from.
If you make any kind of investment, I suggest to learn and make your own analysis of the asset to be able to define entries and exits of such investment.

Versión Español
En el post pasado, inicié un análisis de la situación actual del precio del BTC/USDT, y les había comentado que podía notarse un área de soporte alrededor de los 30.000 USD.
Es importante mencionar que para el Trader, es de suma relevancia tener en cuenta los soportes, resistencias y lugares donde el precio puede llegar a hacer un movimiento específico como AREAS O ZONAS probables, y no como Puntos certeros donde algo va a suceder.
Cuando tenemos en cuenta eso, entendemos que si notamos un soporte en los 30.000 USD, entonces quiere decir que el precio puede descender incluso por debajo de los 30.000, llegando a valores como 29.900, 29,800, 29.700 USD y aun así estar respetando el soporte para que, al cabo de unas horas, realice el respectivo rebote que vuelva a posicionarlo por encima del soporte mencionado.
Dicho esto, podemos ver en la gráfica del día de ayer, como se ha estado conformando un patrón de cuña alcista (donde la punta de la cuña está dirigida hacia abajo), La razón por la que ayer no postee el análisis del activo, es porque al notar este patrón quise esperar unas horas hasta que el rebote sucediera, para poder notar la manera en que se comporta el activo y así poder entender hacia dónde se podría estar dirigiendo.
Gráfica del día de ayer
Gráfica del día de hoy
Aquí podemos ver cómo al cabo de unas horas, el rebote se dio perfectamente (incluso respeto la zona de soporte de los puntos pivotes semanales), y ahora el precio se posiciona nuevamente por encima de los 30.000 USD.
También podemos observar el posible objetivo del activo según este patrón de cuña (señalado con la línea azul vertical), que coincide con el mencionado objetivo en el post anterior; los 40.000 USD.
Se nota que dicho objetivo coincide con el R1 (Resistencia 1, ubicado en la misma zona de los 40500 USD), claro que esto sólo sería posible si supera el punto pivote semanal en los 35.000 USD.
Para finalizar, podemos concluir que:
Los valores importantes del activo en estos momentos son 3:
30.000 USD, nos define el soporte más importante en este momento, antes de que el activo se vaya a "sipote" jajaja.
35.000 USD, una resistencia actual y que por ser punto pivote, marcaría un cambio en la tendencia parcial del activo, llevandolo al alza hasta la siguiente resistencia marcada.
40.000 USD, la siguiente resistencia marcada y posible fin del movimiento alcista parcial, lo que significa que si llega a ese punto, tendría que volverse a evaluar la situación para entender que más podría hacer. Generalmente yo me manejo de esta forma, pues así lo aprendí; un escalón a la vez, sin suponer objetivos demasiado lejanos pues el mercado puede cambiar fácilmente de dirección y hay que re-evaluar constantemente qué va sucediendo.
NOTA: Es importante saber que todo el análisis aquí compartido tiene una intensión sobretodo educacional y no pretende ser una sugerencia de inversión. Por eso intento dar detalles de mi manera de analizar, para que se pueda entender de dónde surgen las zonas que considero de importancia en la operativa.
De hacer algún tipo de inversión, sugiero aprender y hacer tu propio análisis del activo para poder definir entradas y salidas de dicha inversión.
If you want to join Binance Exchange, click here and SIGN UP

If you are interested in belonging to the Erarium community (even if you only speak English), you can access our discord server here, where you will have access to more financial information and we can team up to make investments, trading and financial strategies.
In addition, you can follow us on our social networks, to offer you more interesting information about technical analysis, courses, personalized attention, airdrops, cryptocurrency bots and much more.
Si estás interesado en pertenecer a la comunidad de Erarium (incluso si hablas únicamente Ingles), puedes tener acceso a nuestro servidor en discord aquí, donde tendrás acceso a mayor información del tipo financiero y podemos formar equipo de trabajo para realizar inversiones, trading y estrategias a nivel financiero.
Además, puedes seguirnos en nuestras redes sociales, para ofrecerte más información interesante sobre análisis técnico, cursos, atención personalizada, airdrops, bots de criptomonedas y mucho más.
Sin más que agregar, me despido
ROCEJUMA

Posted Using LeoFinance Beta
Excelente! Sobretodo para establecer un stop loss, es importante tener en cuenta que las areas de soporte pueden extenderse un cierto porcentaje. Sino, puede sacarnos de la operación y luego rebotar y dejarnos en perdidas (me pasaba muchisimo antes).
@tipu curate 4
Upvoted 👌 (Mana: 15/95) Liquid rewards.